
Random Forest Simple Explanation
Understanding the Random Forest with an intuitive example
When learning a technical concept, I find it’s better to start with a high-level overview and work your way down into the details rather than starting at the bottom and getting immediately lost. Along those lines, this post will use an intuitive example to provide a conceptual framework of the random forest, a powerful machine learning algorithm. After getting a basic idea down, I move on to a simple implementation to see how the technique works and if it will be useful to me before finally working out the details by digging deep into the theory. With that in mind, after understanding the overview of the random forest here, feel free to check out part two of this post, an end-to-end example worked out in Python code. Taken together, these two articles will help you conquer the first two steps in the learning process and leave you well prepared to dive as far into the random forest and machine learning as you want!
Decision Tree: The Building Block
To understand the random forest model, we must first learn about the decision tree, the basic building block of a random forest. We all use decision trees in our daily life, and even if you don’t know it by that name, I’m sure you’ll recognize the process. To illustrate the concept, we’ll use an everyday example: predicting the tomorrow’s maximum temperature for our city. To keep things straight, I’ll use Seattle, Washington, but feel free to pick your own city.
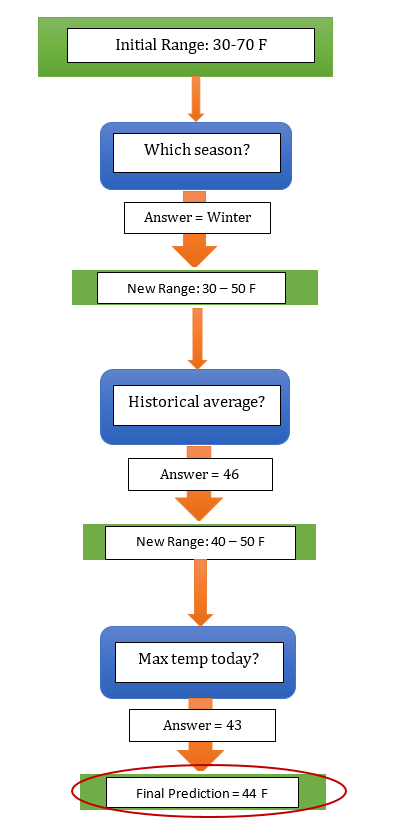
In order to answer the single max temperature question, we actually need to work through an entire series of queries. We start by forming an initial reasonable range given our domain knowledge, which for this problem might be 30–70 degrees (Fahrenheit) if we do not know the time of year before we begin. Gradually, through a set of questions and answers we reduce this range until we are confident enough to make a single prediction.
What makes a good question to ask? Well, if we want to limit the range as much as is possible, it would be wise to think of queries that are relevant to the problem at hand. Since temperature is highly dependent on time of year, a decent place to start would be: what is the season? In this case, the season is winter, and so we can limit the prediction range to 30–50 degrees because we have an idea of what the general max temperatures are in the Pacific Northwest during the winter. This first question was a great choice because it has already cut our range in half. If we had asked something non-relevant, such as the day of the week, then we could not have reduced the extent of predictions at all and we would be back where we started. Nonetheless, this single question isn’t quite enough to narrow down our estimate so we need to find out more information. A good follow-up question is: what is the historical average max temperature on this day? For Seattle on December 27, the answer is 46 degrees. This allows us to further restrict our range of consideration to 40–50 degrees. Again, this was a high-value question because it greatly reduced the scope of our estimate.
Two questions are still not quite enough to make a prediction because this year might be warmer or colder than average. Therefore, we also would want to look at the max temperature today to get an idea if the year has been unusually warm or cold. Our question is simple: what is the maximum temperature today? If the max temperature today was 43 degrees, it might be colder this year and our estimate for tomorrow should be a little lower than the historical average. At this point, we can feel pretty confident in making a prediction of 44 degrees for the max temperature tomorrow. If we wanted to be even more sure, we could consult additional sources such as AccuWeather or Weather Underground to get information such as the forecast for the max temperature that we could incorporate into our mental model. However, at some point there is a diminishing return to asking more questions, and we cannot keep gathering more data for ever. For now, let us settle with using those three questions to make a prediction.
So, to arrive at an estimate, we used a series of questions, with each question narrowing our possible values until we were confident enough to make a single prediction. We repeat this decision process over and over again in our daily lives with only the questions and answers changing. At this point we are nearly ready to make the connection to the decision tree, but let’s take just a minute to look at a graphical representation of the intuitive steps we took to find our answer:
 Decision Process for Temperature Prediction
We start with an initial guess based on our knowledge of the world and refine our estimate as we gain more information. Eventually, we stop gathering data and make a decision, which in this case is the max temperature prediction. Our natural approach to the problem is what we might call a question-and-answer flowchart. In fact, this flowchart is also a rudimentary model of a decision tree! However, we have not quite built a full decision tree because as humans we take some shortcuts that make sense for us but are not so intuitive to a machine.
There are two main differences between our illustrated decision process and a real decision tree. First, we have neglected to list the alternative branches, that is the predictions we would have made if the answers to the questions had been different: for example, if the season had been summer instead of winter, our range of predictions would have been shifted higher. Moreover we phrased our questions such that they could take on any number of answers: when we asked ‘what is the maximum temperature today?’ the answer could be any real value. In contrast, a decision tree implemented in machine learning will list all possible alternatives to every question and will ask all questions in True/False form. This is a little tough to grasp because it is not how humans naturally think, and perhaps the best way to show this difference is to create a real decision tree from our prediction process:
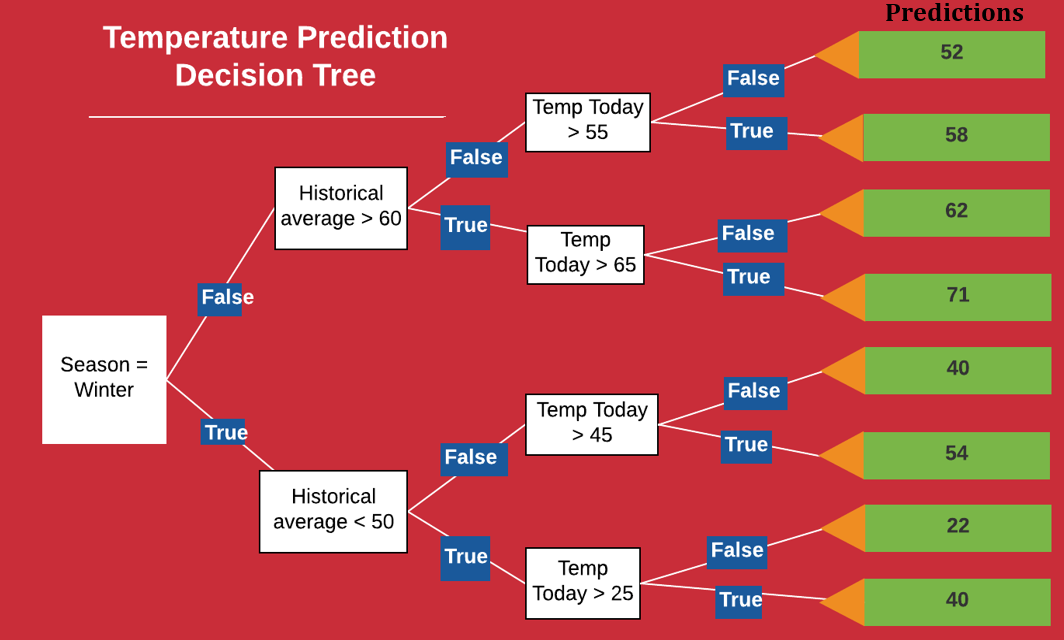 Machine Learning Decision Tree for Temperature Prediction
We notice right away that each question (the white blocks) has only two answers: True or False. Moreover, for each True and False answer there are separate branches. No matter the answers to the questions, we eventually reach a prediction (shown in the green blocks). This ‘computer-friendly’ version of the decision tree may look different than our intuitive model, but it works in the exact same way. Start at the node on the left, and progress through the tree answering the questions along the way. For our example, the season is winter so we take the True branch. We said the historical average was 46, so the second question is also True. Finally, the third answer is True as the max temperature today was 43. Therefore, the final prediction is 40 degrees for the max temperature tomorrow, close to our guess of 44.
This model here encompasses all the basic qualities of a decision tree. I purposefully left out all technical details, such as how the ‘questions’ are formed and how the thresholds are set, but these aren’t really necessary to understand the model conceptually or even to implement it in Python code!
One aspect of the decision tree I should mention is how it actually learns. We refined our estimated range based on how the answers to the questions fit into our framework of the world. If the season is winter, our estimate is lower than if it is summer. However, a computer model of a decision tree has no prior knowledge and would never be able to make the connection ‘winter = colder’ on its own. It must learn everything about the problem from the data we provide it. We know how to translate answers from the flow-chart into reasonable predictions because our of daily experiences. In contrast, the model must be taught each of these relationships such as that if the temperature today is warmer than the historical average, the max temperature tomorrow will likely be warmer as well. As a supervised machine learning model, a random forest learns to map data (temperature today, historical average, etc.) to outputs (max temperature tomorrow) in what is called the training (or fitting) phase of model building.
During training, we give the model any historical data that is relevant to the problem domain (the temperature the day before, the season of the year, and the historical average) and the true value we want the model to learn to predict, in this case the max temperature tomorrow. The model learns any relationships between the data (known as features in machine learning) and the values we want to predict (called the target). The decision tree forms the structure shown above, calculating the best questions to ask in order to make the most accurate estimates possible. When we ask the decision tree to make a prediction for tomorrow, we must give it the same data it used during training (the features) and it gives us an estimate based on the structure it has learned. Much as humans learn from examples, the decision tree also learns through experience, except it does not have any previous knowledge it can incorporate into the problem. Before training, we are much ‘smarter’ than the tree in terms of our ability to make a reasonable estimate. However, after enough training with quality data, the decision tree will far surpass our prediction abilities. Keep in mind the decision tree does not have any conceptual understanding of the problem even after training. From the model’s ‘perspective’, it is simply receiving numbers as inputs and outputting different numbers that agree with those it saw during training. In other words, the tree has learned how to map a set of features to targets with no knowledge of anything about temperature. If we ask the decision tree another weather related question, it will have no clue how to respond because it has been trained for one specific task.
That is basically the entire high-level concept of a decision tree: a flowchart of questions leading to a prediction. Now, we take the mighty leap from a single decision tree to a random forest!
From Decision Tree to Random Forest
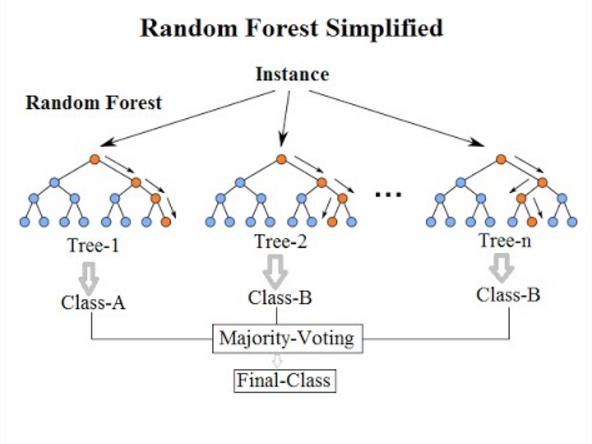
My prediction for the maximum temperature is probably wrong. And I hate to break it to you, but so is yours. There are too many factors to take into account, and chances are, each individual guess will be high or low. Every person comes to the problem with different background knowledge and may interpret the exact same answer to a question entirely differently. In technical terms, the predictions have variance because they will be widely spread around the right answer. Now, what if we take predictions from hundreds or thousands of individuals, some of which are high and some of which are low, and decided to average them together? Well, congratulations, we have created a random forest! The fundamental idea behind a random forest is to combine many decision trees into a single model. Individually, predictions made by decision trees (or humans) may not be accurate, but combined together, the predictions will be closer to the mark on average.
Why exactly is a random forest better than a single decision tree? We can think about it terms of having hundreds of humans make estimates for the max temperature problem: by pooling predictions, we can incorporate much more knowledge than from any one individual. Each individual brings their own background experience and information sources to the problem. Some people may swear by Accuweather, while others will only look at NOAA (National Oceanic and Atmospheric Administration) forecasts. Perhaps one person relies on a meteorologist friend for their predictions while another uses hundred of years of temperature data. If we only ask one individual, we would only take advantage of their limited scope of information, but by combining everyone’s predictions together, our net of information is much greater. Furthermore, the more diverse each person’s source of information, the more robust the random forest is because it will not be swayed by a single anomalous data source. If NOAA goes rogue and starts making predictions over 100 degrees and everyone relied on NOAA, then our entire model would be worthless. If instead, individuals in our ‘forest’ use a number of different weather sources, then our model will not be greatly affected by a single source and we can continue to make reasonable predictions.
Why the name ‘random forest?’ Well, much as people might rely on different sources to make a prediction, each decision tree in the forest considers a random subset of features when forming questions and only has access to a random set of the training data points. This increases diversity in the forest leading to more robust overall predictions and the name ‘random forest.’ When it comes time to make a prediction, the random forest takes an average of all the individual decision tree estimates. (This is the case for a regression task, such as our problem where we are predicting a continuous value of temperature. The other class of problems is known as classification, where the targets are a discrete class label such as cloudy or sunny. In that case, the random forest will take a majority vote for the predicted class). With that in mind, we now have down all the conceptual parts of the random forest!
Wrap-Up
Machine learning may seem intimidating at first, but the entire field is just many simple ideas combined together to yield extremely accurate models that can ‘learn’ from past data. The random forest is no exception. There are two fundamental ideas behind a random forest, both of which are well known to us in our daily life:
- Constructing a flowchart of questions and answers leading to a decision
- The wisdom of the (random and diverse) crowd
It is the combination of these basic ideas that lead to the power of the random forest model.
Now that you hopefully have the conceptual framework of a random forest, I recommend you take a look at the second part of this post, where we walk through the entire process of implementing a random forest for the max temperature problem in the Python programming language. Even if you have never programmed before, you should be able to follow along! If this post has sparked your curiosity, there are any number of resources out there to learn more. Sometimes too many resources can be overwhelming when trying to learn a new concept, so I’ll limit my recommendations to a great website made by the creator of the random forest (Leo Breiman), the free Coursera series on random forests, and the excellent book Introduction to Statistical Learning (by James, Witten, Hastie, and Tibshirani) which is available free online. With programming in general, and machine learning in particular, there are so many resources freely available online that match or even exceed any formal education so feel as if you are behind if you never saw this in college!
As always, I appreciate any feedback and constructive criticism. My email is wjk68@case.edu.