
Interactive Controls For Jupyter Notebooks

How to use interactive IPython widgets to enhance data exploration and analysis
There are few actions less efficient in data exploration than re-running the same cell over and over again, each time slightly changing the input parameters. Despite knowing this, I still find myself repeatedly executing cells just to make the slightest change, for example, choosing a different value for a function, selecting various date ranges for analysis, or even adjusting the theme of a plotly visualization. Not only is this inefficient, but it’s also frustrating, disrupting the flow of an exploratory data analysis.
The ideal solution to this issue would be interactive controls to change inputs without needing to rewrite or rerun code. Fortunately, as is often the case in Python, someone has already run into this problem and developed a great tool to solve it. In this article, we’ll see how to get started with thedocs.io/en/stable/user_guide.html?) ( ipywidgets), interactive controls you can build with one line of code. This library allows us to turn Jupyter Notebooks from static documents into interactive dashboards, perfect for exploring and visualizing data.
You can view a completely interactive running notebook with the widgets in this article on mybinder by clicking the image below.
IPython widgets, unfortunately, do not render on GitHub or nbviewer but you can still access the notebook and run locally.
 Example of interactive widgets for data visualization
Getting Started with IPywidgets
The first step, as usual, is installing the library: pip install ipywidgets .
Once that finishes, you can activate widgets for Jupyter Notebook with
jupyter nbextension enable --py widgetsnbextension
To use with JupyterLab, run:
jupyter labextension install @jupyter-widgets/jupyterlab-manager
To import the ipywidgetslibrary in a notebook, run
import ipywidgets as widgets
from ipywidgets import interact, interact_manual
Single Line Interactive Controls
Let’s say we have the following dataframe with Medium article statistics (these are my actual stats, you can see how to get them in this article):
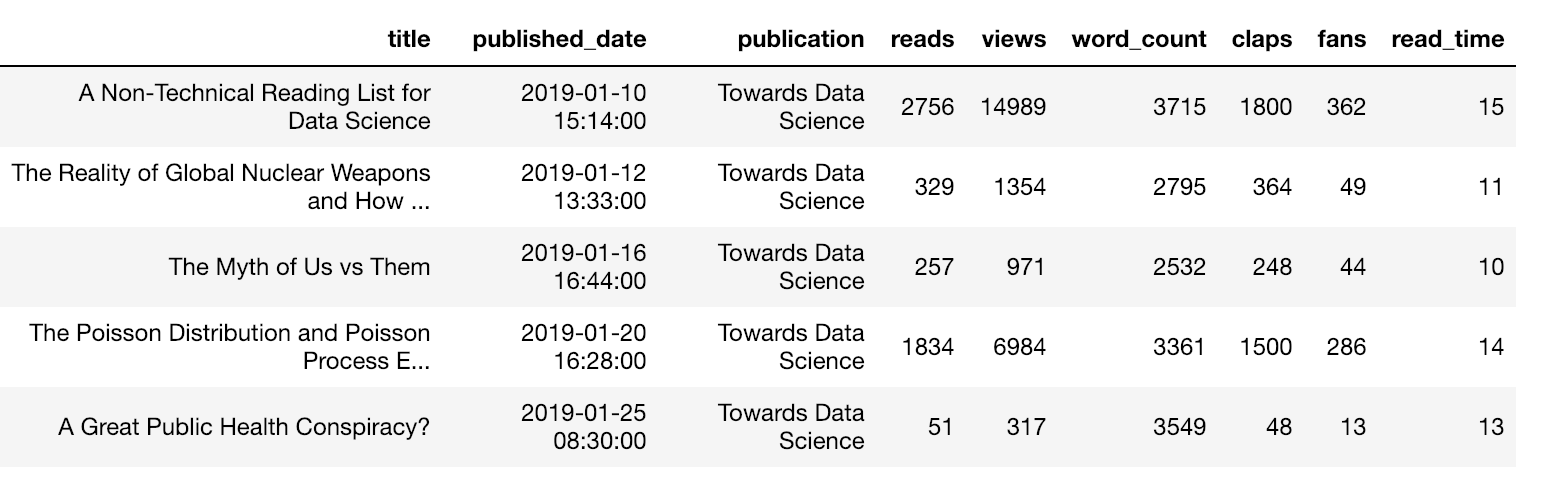 Dataframe of Medium stats
How can we view all articles with more than 1000 reads? Here’s one way:
df.loc[df['reads'] > 1000]
But if we want to show articles with more than 500 claps, we have to write another line of code:
df.loc[df['claps'] > 500]
Wouldn’t it be nice if we could just rapidly change these parameters — both the column and threshold — without writing more code? Try this:
@interact
def show_articles_more_than(column='claps', x=5000):
    return df.loc[df[column] > x]
 Interactive controls using @interact
With the @interact decorator automatically gives us a text box and a slider for choosing a column and number! It looks at the inputs to our function and creates interactive controls based on the types. Now we can segment the data using the controls (widgets) without writing code.
You may have noticed some problems with the widgets — x can go negative and we had to type in the correct column name. We can fix these by providing specific arguments to the function parameters:
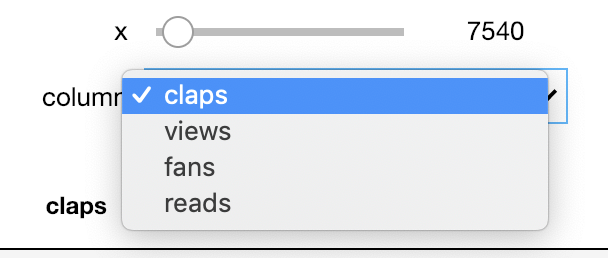 Improved widgets for subsetting data.
Now we get a dropdown for the column (with the options in the list) and an integer slider limited to a range (the format is (start, stop, step) ). Read through the documentation for the full details of how function parameters are mapped to widgets.
We can use this same @interact decorator to quickly turn any ordinary function into an interactive widget. For example, we may have a lot of images in a directory we want to quickly look through:
import os
from IPython.display import Image

@interact
def show_images(file=os.listdir('images/')):
    display(Image(fdir+file))
 Example of browsing images using IPython widgets
Now we can quickly cycle through all the images without re-running the cell. This might actually be useful if you were building a convolutional neural network and wanted to examine the images your network had missclassified.
The uses of widgets for data exploration are boundless. Another simple example is finding correlations between two columns:
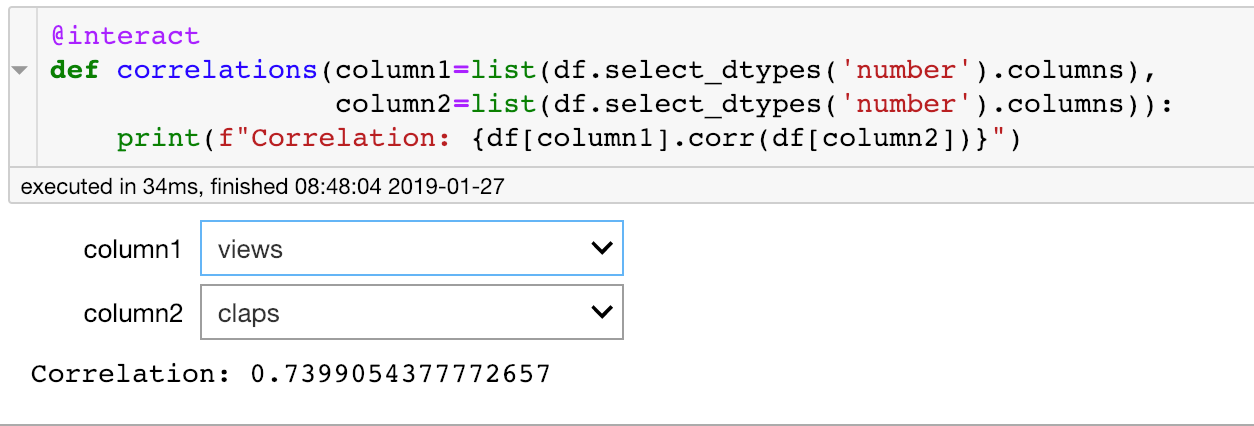 Widget for correlation between two columns.
There are numerous helpful examples on the ipywidgets GitHub.
Widgets for Plots
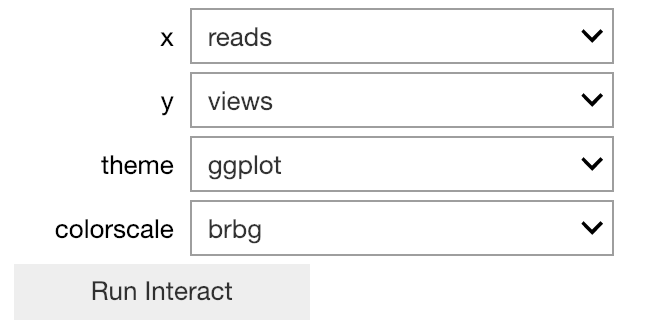
Interactive widgets are especially helpful for selecting data to plot. We can use the same @interact decorator with functions that visualize our data:
 Interactive scatter plot made using cufflinks+plotly with IPywidgets controls
Here we are using the amazing cufflinks+plotly combination to make an interactive plot with interactive IPython widget controls.
You may have noticed the plot was a little slow to update. If that is the case, we can use @interact_manual which requires a button for updating.
 Button made with @interact_manual decorator.
Now the plot will only be updated when the button is pressed. This is useful for functions that take a while to return an output.
Expanding the Capabilities of Interactive Controls
To get more from the IPywidgets library, we can make the widgets ourselves and use them int the interact function. One of my favorite widgets is the DatePicker. Say we have a function, stats_for_article_published_between, that takes a start and end date and prints stats for all the articles published between them. We can make this interactive using the following code
Now we get two interactive date selection widgets and the values are passed into the function (see notebook for details):
 Interactive date selection controls.
Similarly, we can make a function that plots the cumulative total of a column up until a date using the same DataPicker interactive widget.
 Cumulative plot of a column using interactive widgets.
If we want to make the options for one widget dependent on the value of another, we use the observe function. Here, we alter the image browser function to choose both the directory and image. The list of images displayed is updated based on the directory we select.
Code to make the images widget dependent on the value of the directory widget
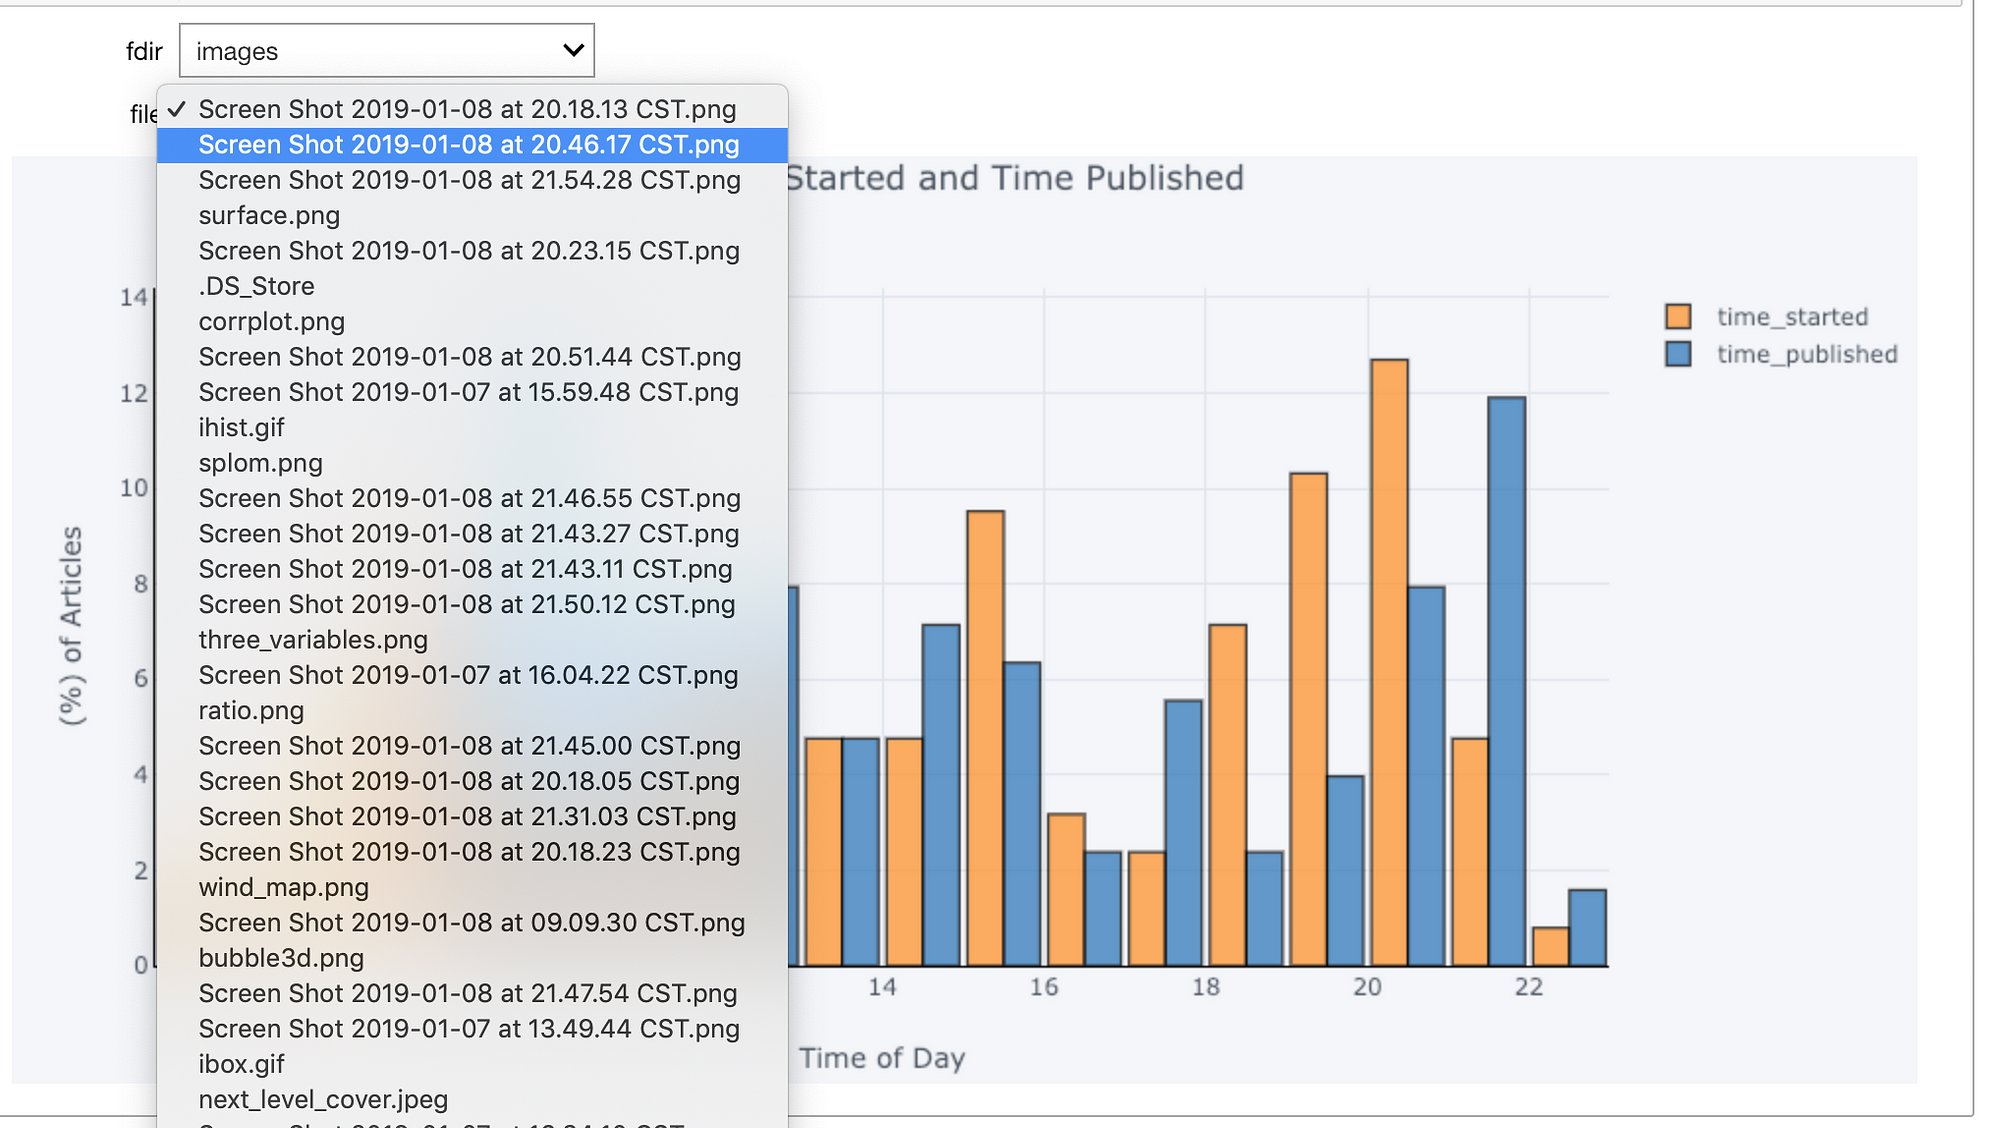
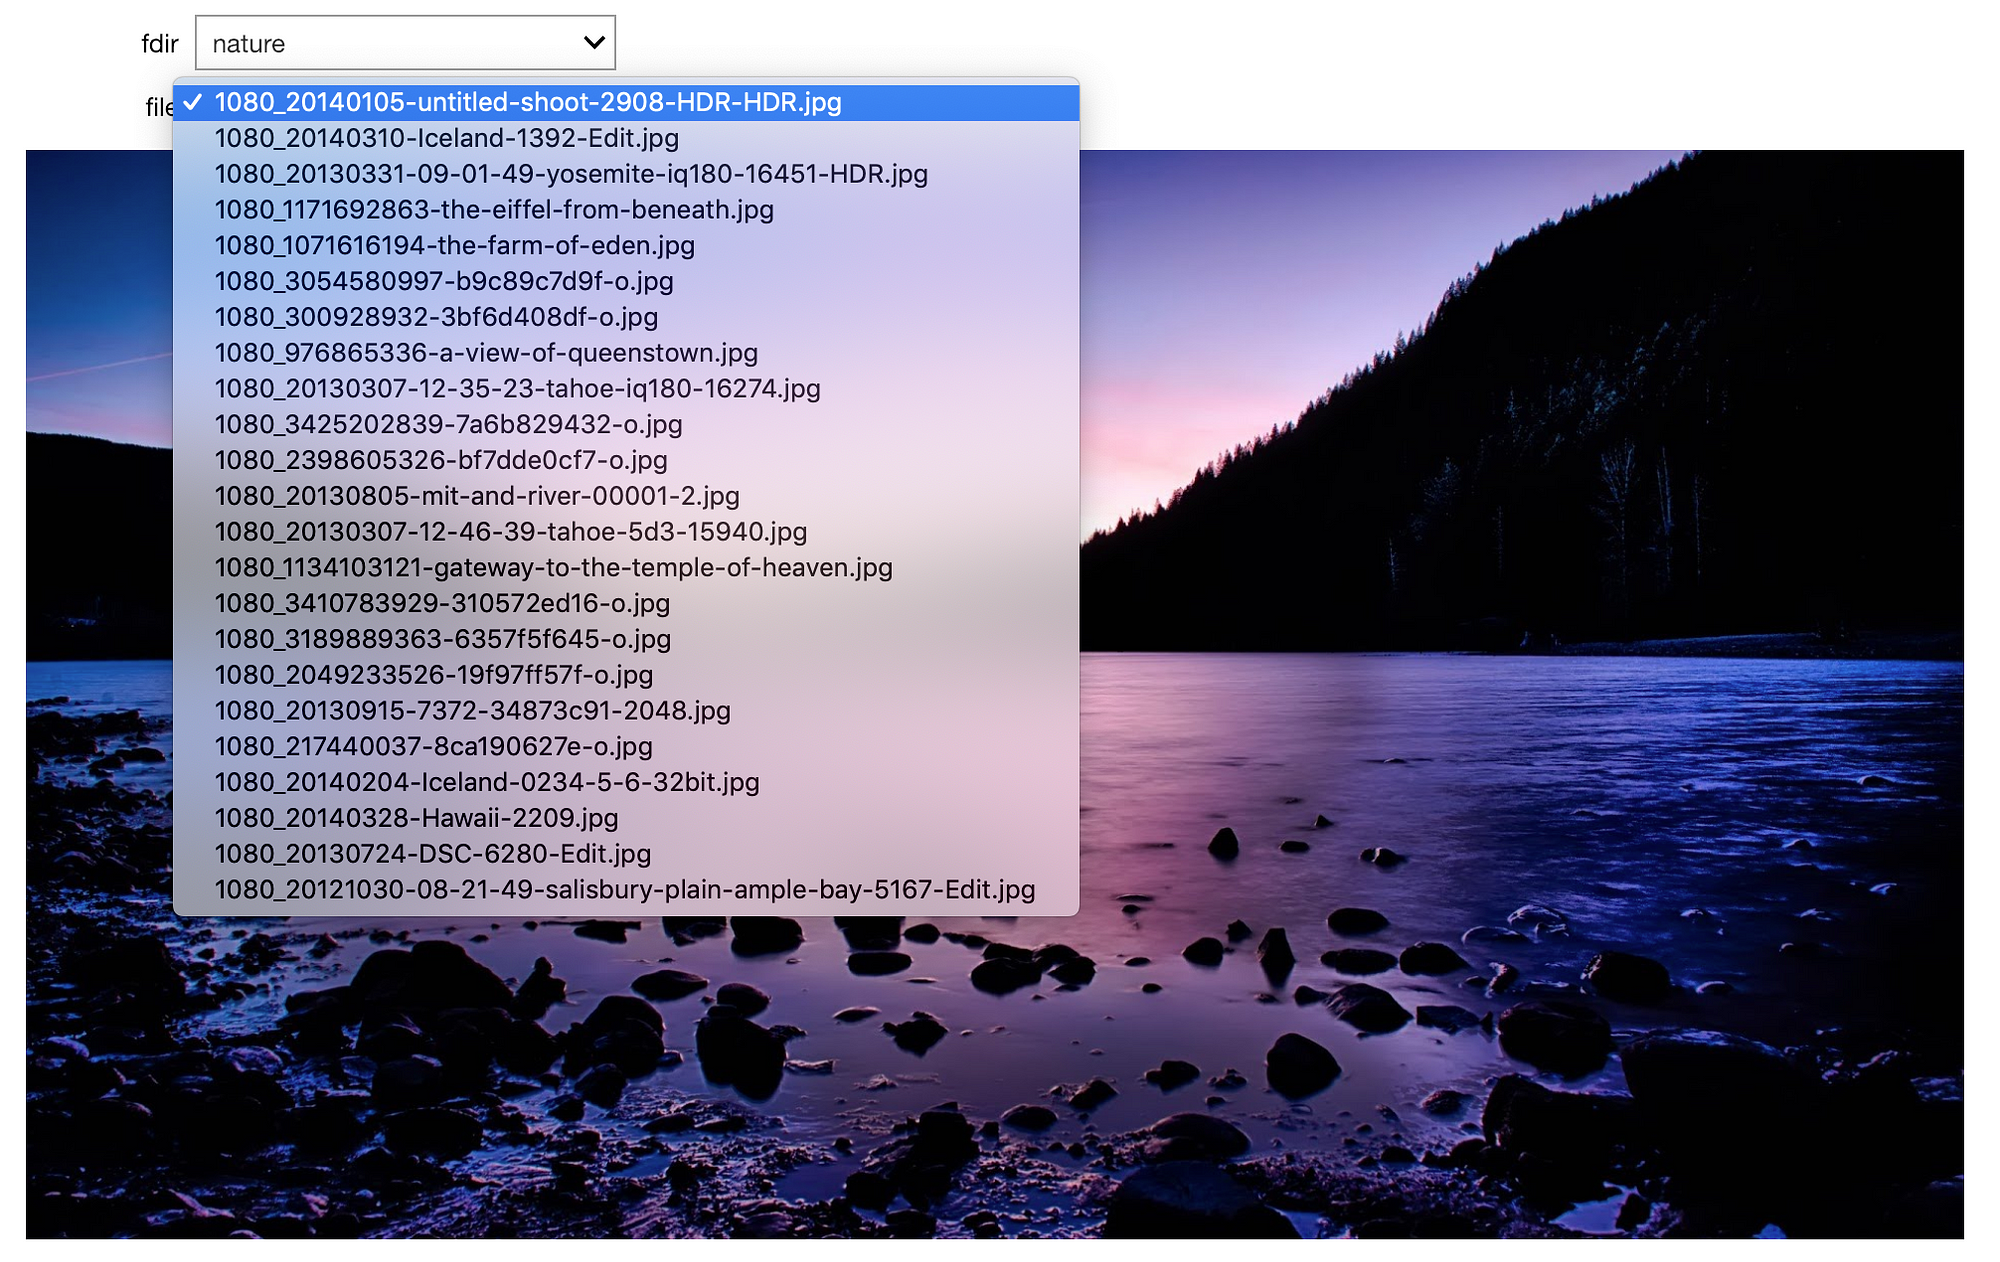 Left show image options when the directory is “images” and right shows options when directory is “nature”.
Reusable Widgets
When we want to reuse widgets across cells, we just need to assign them to the output of theinteract function.
Now, to reuse the stats widget, we can just call stats.widget in a cell.
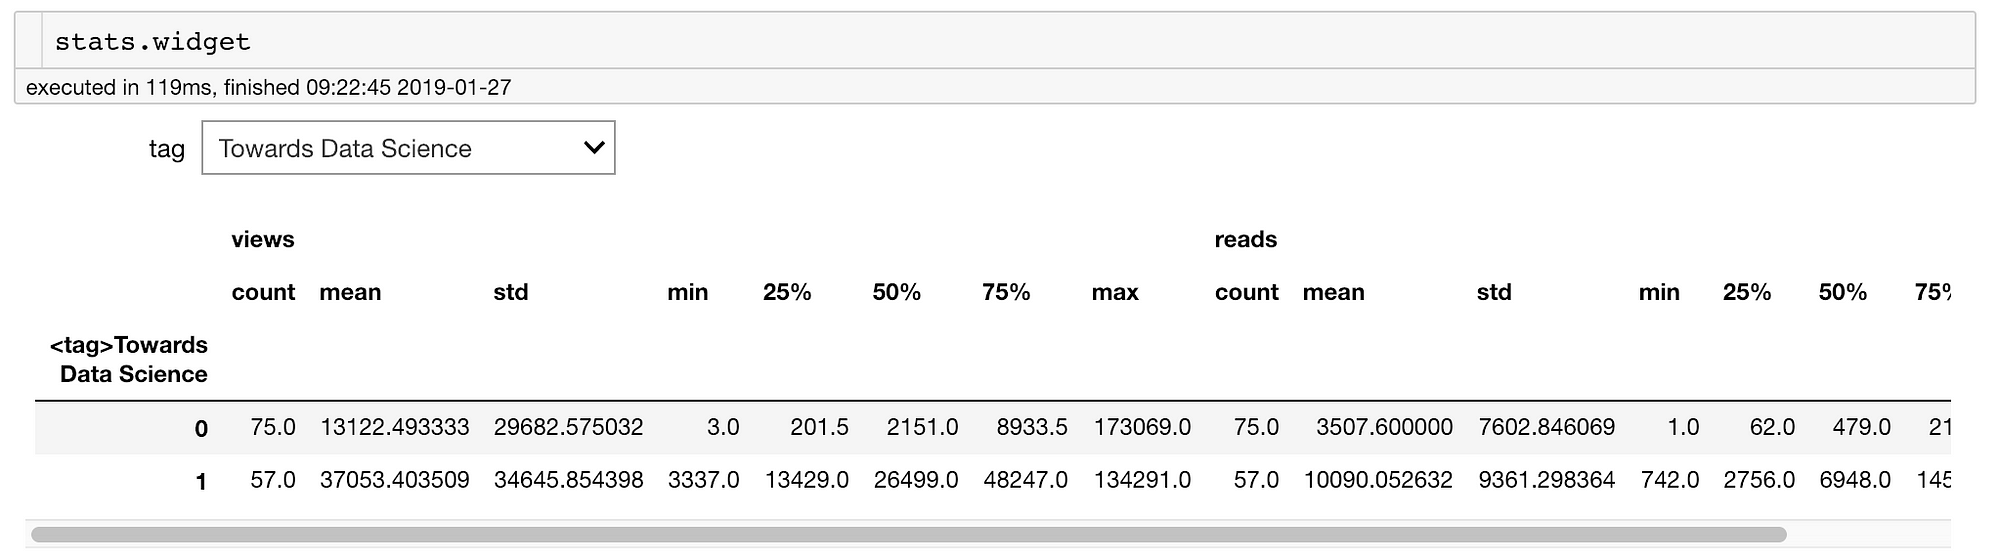 The same widget used in another cell.
This lets us reuse our widgets across a notebook. As a note, the widgets are tied to one another meaning the value in one cell will be automatically updated to the value you select for the same widget in another cell.
We haven’t gotten close to covering all the capabilities of IPywidgets. For instance, we can link values together, create custom widgets, make buttons, build animations, create a dashboard with tabs, and so on. thedocs.io/en/stable/user_guide.html?). Even with the small amount covered here, I hope you see how interactive controls can enhance a notebook workflow!
 Simple widget to select theme for a plot.
Conclusions
The Jupyter Notebook is a great data exploration and analysis environment. However, by itself, it doesn’t offer the best functionality. Using tools like notebooks extensions and interactive widgets make the notebook come to life and make our jobs as data scientists more efficient. Furthermore, building widgets and using them in a notebook is simply fun! Writing lots of code to do the same task repeatedly is not enjoyable, but using interactive controls creates a more natural flow for our data explorations and analyses.
As always, I welcome feedback and constructive criticism. I can be reached on Twitter @koehrsen_will.