
Machine Learning Kaggle Competition Part One Getting Started

Learning the Kaggle Environment and an Introductory Notebook
In the field of data science, there are almost too many resources available: from Datacamp to Udacity to KDnuggets, there are thousands of places online to learn about data science. However, if you are someone who likes to jump in and learn by doing, Kaggle might be the single best location for expanding your skills through hands-on data science projects.
While it originally was known as a place for machine learning competitions, Kaggle — which bills itself as “Your Home for Data Science” — now offers an array of data science resources. Although this series of articles will focus on a competition, it’s worth pointing out the main aspects of Kaggle:
- Datasets: Tens of thousands of datasets of all different types and sizes that you can download and use for free. This is a great place to go if you are looking for interesting data to explore or to test your modeling skills.
- Machine Learning Competitions: once the heart of Kaggle, these tests of modeling skill are a great way to learn cutting edge machine learning techniques and hone your abilities on interesting problems using real data.
- Learn: A series of data science learning tracks covering SQL to Deep Learning taught in Jupyter Notebooks.
- Discussion:A place to ask questions and get advice from the thousands of data scientists in the Kaggle community.
- Kernels: Online programming environments running on Kaggle’s servers where you can write Python/R scripts, or Jupyter Notebooks. These kernels are entirely free to run (you can even add a GPU) and are a great resource because you don’t have to worry about setting up a data science environment on your own computer. The kernels can be used to analyze any dataset, compete in machine learning competitions, or complete the learning tracks. You can copy and build on existing kernels from other users and share your kernels with the community for feedback.
 The main aspects of Kaggle
Overall, Kaggle is a great place to learn, whether that’s through the more traditional learning tracks or by competing in competitions. When I want to find out about the latest machine learning method, I could go read a book, or, I could go on Kaggle, find a competition, and see how people use it in practice. Personally, I find this much more enjoyable and a more effective teaching method. Moreover, the community is extremely supportive and always willing to answer questions or provide feedback on a project.
In this article, we’ll focus on getting started with a Kaggle machine learning competition: the Home Credit Default Risk problem. This is a fairly straightforward competition with a reasonable sized dataset (which can’t be said for all of the competitions) which means we can compete entirely using Kaggle’s kernels. This significantly lowers the barrier to entry because you don’t have to worry about any software on your computer and you don’t even have to download the data! As long as you have a Kaggle account and an Internet connection, you can connect to a kernel and run the code.
I plan to do the entire competition on Kaggle and the kernel (a Python Jupyter Notebook) for this post is available here. To get the most from this article, copy the kernel by creating a Kaggle account, then hitting the blue Fork Notebook button. This will open up the notebook for editing and running in the kernel environment.
Competition Description
The Home Credit Default Risk competition is a standard supervised machine learning task where the goal is to use historical loan application data to predict whether or not an applicant will repay a loan. During training, we provide our model with the features — the variables describing a loan application — and the label — a binary 0 if the loan was repaid and a 1 if the loan was not repaid — and the model learns a mapping from the features to the label. Then, during testing, we feed the model the features for a new batch of applications and ask it to predict the label.
All the data for this competition is structured meaning it exists in neat rows and columns — think a spreadsheet. This means we won’t need to use any convolutional neural networks (which excel at processing image data ) and it will give us great practice on a real-world dataset.
Home Credit, the host of the competition, is a finance provider that focuses on serving the unbanked population. Predicting whether or not an application will repay a loan is a vital business need, and Home Credit has developed this competition in the hopes that the Kaggle community can develop an effective algorithm for this task. This competition follows the general idea of most Kaggle competitions: a company has data and a problem to solve, and rather than (or in addition to) hiring internal data scientists to build a model, they put up a modest prize to entice the entire world to contribute solutions. A community of thousands of skilled data scientists (Kagglers) then work on the problem for basically no charge to come up with the best solution. As far as cost effective business plans go, this seems like a brilliant idea!
Kaggle Competition Environment
When you go to the competition homepage, you’ll see this:
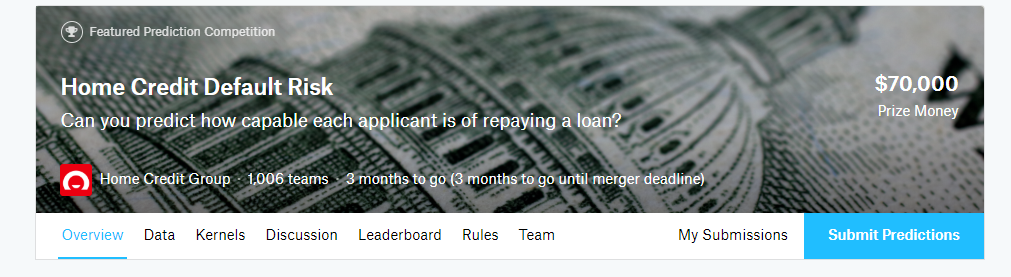 Here’s a quick run through of the tabs
- Overview: a brief description of the problem, the evaluation metric, the prizes, and the timeline
- Data: all of the data needed for the competition as external data is not allowed. You can download all of the data, but we won’t need to do that because we will be using a Kaggle Kernel which can connect to the data.
- Kernels: Previous work done by you and other competitors. This —in my opinion — is the most valuable resource for a competition. You can read through other scripts and notebooks and then copy the code (called “Forking”) to edit and run.
- Discussion: another helpful resource where you can find conversations both from the competition hosts and from other competitors. A great place to ask questions and learn from the answers of others.
- Leaderboard: who’s on top and where you stand
- Rules: not very interesting, but good to understand
- Team: manage the members of your team if you decide to form a team
- My Submissions: view your previous submissions and select the final ones to be used for the competition
The Importance of Learning from Others
Although they are called competitions, Kaggle machine learning events should really be termed “collaborative projects” because the main goal is not necessarily to win but to practice and learn from fellow data scientists. Once you realize that it’s not so much about beating others but about expanding your own skills, you will get a lot more out of the competitions. When you sign up for Kaggle, you not only get all the resources , you also get to be part of a community of data scientists with thousands of years of collective experience.
Take advantage of all that experience by trying to be an active part of the community! That means anything from sharing a kernel to asking a question in a discussion forum. While it can be intimidating to make your work public, we learn best by making mistakes, receiving feedback, and improving so we don’t make the same mistake again. Everyone starts out a beginner, and the community is very supportive of data scientists of all skill levels.
In that mindset, I want to emphasize that discussion with others and building on others’ code is not only acceptable, but encouraged! In school, working with others is called cheating and gets you a zero, but in the real world, it’s called collaboration and an extremely important skill.
A great method for throwing yourself into a competition is to find a kernel someone has shared with a good leaderboard score, fork the kernel, edit it to try and improve the score, and then run it to see the results. Then, make the kernel public so others can use your work. Data scientists stand not on the shoulders of giants, but on the backs of thousands of individuals who have made their work public for the benefit of all. (Sorry for getting philosophical, but this is why I love data science!)
Working Through a First Notebook
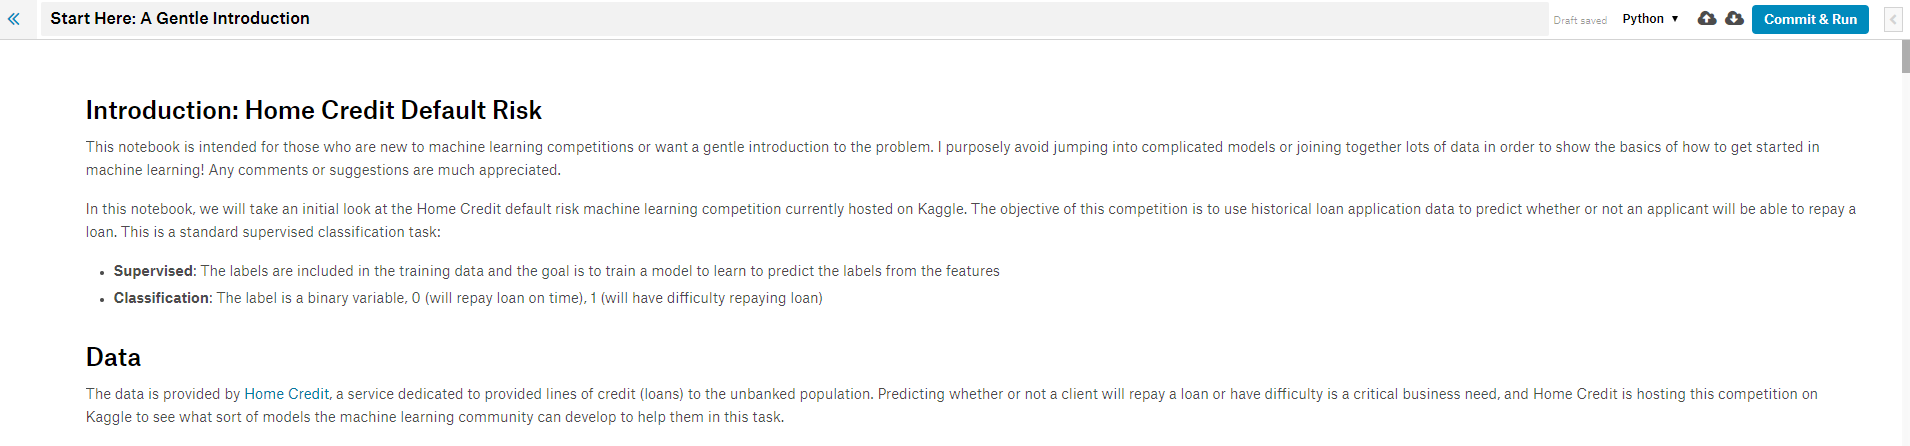
Once you have a basic understanding of how Kaggle works and the philosophy of how to get the most out of a competition, it’s time to get started. Here, I’ll briefly outline a Python Jupyter Notebook I put together in a kernel for the Home Credit Default Risk problem, but to get the full benefit, you’ll want to fork the notebook on Kaggle and run it yourself (you don’t have to download or set-up anything so I’d highly encourage checking it out).
When you open the notebook in a kernel, you’ll see this environment:
 Kernel Notebook Environment
Think of this as a standard Jupyter Notebook with slightly different aesthetics. You can write Python code and text (using Markdown syntax) just like in Jupyter and run the code completely in the cloud on Kaggle’s servers. However, Kaggle kernels have some unique features not available in Jupyter Notebook. Hit the leftward facing arrow in the upper right to expand the kernel control panel which brings up three tabs (if the notebook is not in fullscreen, then these three tabs may already be visible next to the code).
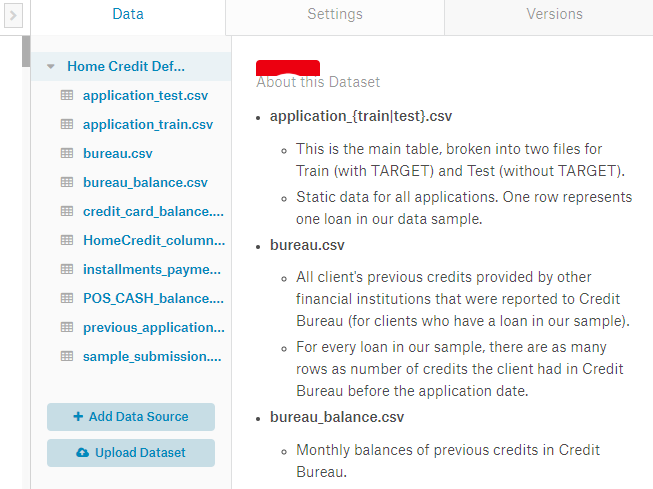 In the data tab, we can view the datasets to which our Kernel is connected. In this case, we have the entire competition data, but we can also connect to any other dataset on Kaggle or upload our own data and access it in the kernel. Data files are available in the
 ../input/ directory from within the code:
import os

# List data files that are connected to the kernel
os.listdir('../input/')
 Files connected to the kernel available in ../input/
The Settings tab lets us control different technical aspects of the kernel. Here we can add a GPU to our session, change the visibility, and install any Python package which is not already in the environment.
Finally, the Versions tab lets us see any previous committed runs of the code. We can view changes to the code, look at log files of a run, see the notebook generated by a run, and download the files that are output from a run.
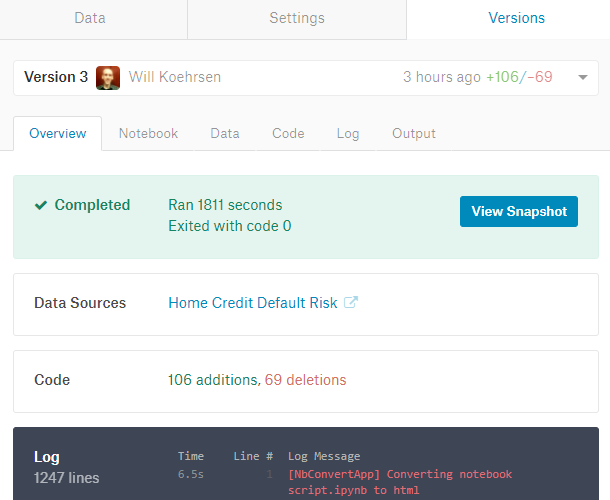 Versions Tab
To run the entire notebook and record a new Version, hit the blue Commit & Run button in the upper right of the kernel. This executes all the code, shows us the completed notebook (or any errors if there are mistakes), and saves any files that are created during the run. When we commit the notebook, we can then access any predictions our models made and submit them for scoring.
Introductory Notebook Outline
The first notebook is meant to get you familiar with the problem. We start off much the same way as any data science problem: understanding the data and the task. For this problem, there is 1 main training data file (with the labels included), 1 main testing data file, and 6 additional data files. In this first notebook, we use only the main data, which will get us a decent score, but later work will have to incorporate all the data in order to be competitive.
To understand the data, it’s best to take a couple minutes away from the keyboard and read through the problem documentation, such as the column descriptions of each data file. Because there are multiple files, we need to know how they are all linked together, although for this first notebook we only use the main file to keep things simple. Reading through other kernels can also help us get familiar with the data and which variables are important.
Once we understand the data and the problem, we can start structuring it for a machine learning task This means dealing with categorical variables (through one-hot encoding), filling in the missing values (imputation), and scaling the variables to a range. We can do exploratory data analysis, such as finding correlations with the label, and graphing these relationships.
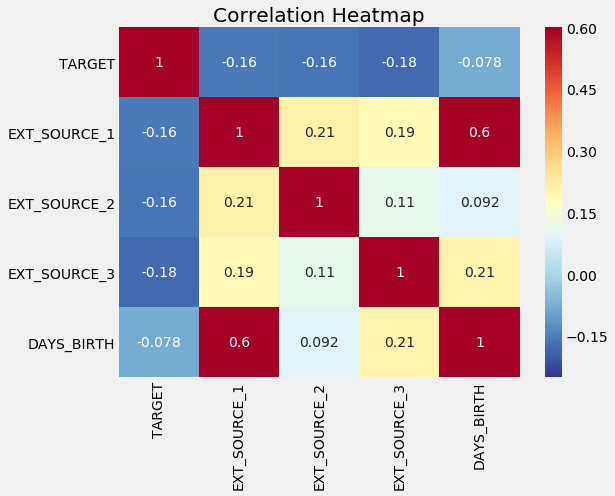 Correlation Heatmap of Variables
We can use these relationships later on for modeling decisions, such as including which variables to use. (See the notebook for implementation).
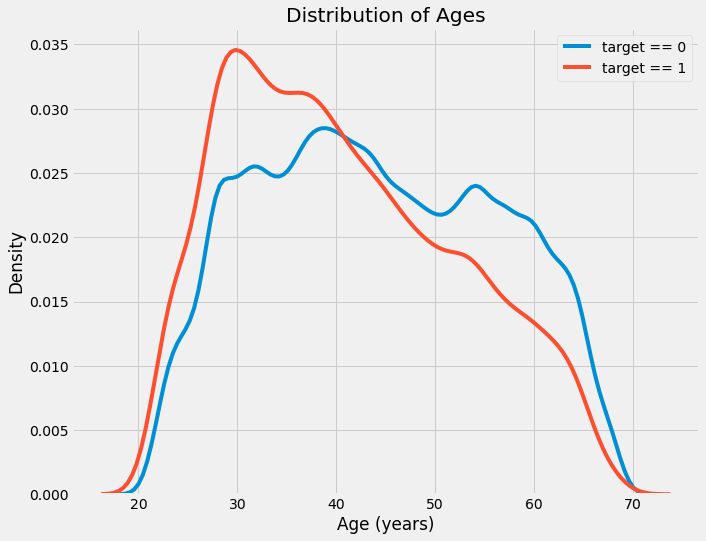
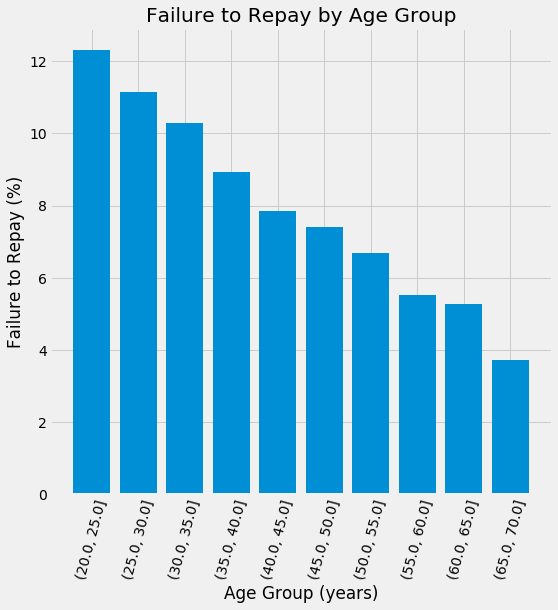 Distribution of Ages Colored by Label (left) and Rates of Default by Age Group (right)
Of course, no exploratory data analysis is complete without my favorite plot, the Pairs Plot.
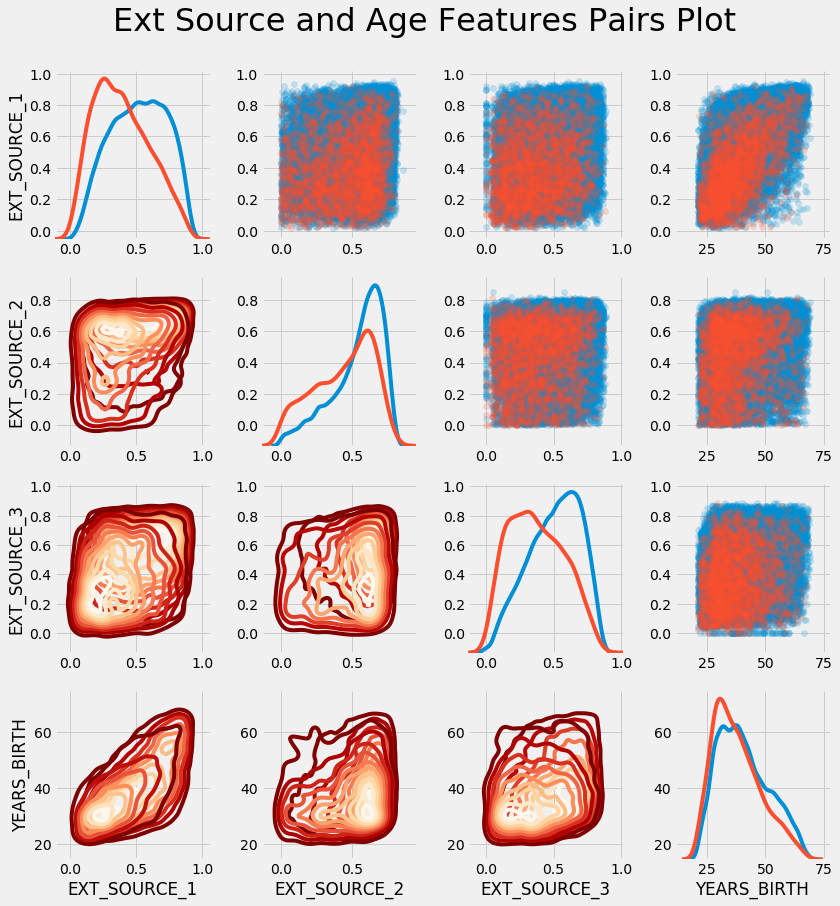 Pairs Plot of Features (red indicates loans that were not repaid in the kde and scatter plots)
After thoroughly exploring the data and making sure it’s acceptable for machine learning, we move on to creating baseline models. However, before we quite get to the modeling stage, it’s critical we understand the performance metric for the competition. In a Kaggle competition, it all comes down to a single number, the metric on the test data.
While it might make intuitive sense to use accuracy for a binary classification task, that is a poor choice because we are dealing with an imbalanced class problem. Instead of accuracy, submissions are judged in terms of ROC AUC or Receiver Operating Characteristic curve Area Under the Curve. I’ll let you do the research on this one, or read the explanation in the notebook. Just know that higher is better, with a random model scoring 0.5 and a perfect model scoring 1.0. To calculate a ROC AUC, we need to make predictions in terms of probabilities rather than a binary 0 or 1. The ROC then shows the True Positive Rate versus the False Positive Rate as a function of the threshold according to which we classify an instance as positive.
Usually we like to make a naive baseline prediction, but in this case, we already know that random guessing on the task would get an ROC AUC of 0.5. Therefore, for our baseline model, we will use a slightly more sophisticated method, Logistic Regression. This is a popular simple algorithm for binary classification problems and it will set a low bar for future models to surpass.
After implementing the logistic regression, we can save the results to a csv file for submission. When the notebook is committed, any results we write will show up in the Output sub-tab on the Versions tab:
 Output from running the complete notebook
From this tab, we can download the submissions to our computer and then upload them to the competition. In this notebook, we make four different models with scores as follows:
- Logistic Regression: 0.671
- Random Forest: 0.678
- Random Forest with Constructed Features: 0.678
- Light Gradient Boosting Machine: 0.729
These scores don’t get us anywhere close to the top of the leaderboard, but they leave room for plenty of future improvement! We also get an idea of the performance we can expect using only a single source of data.
(Not surprisingly, the extraordinary Gradient Boosting Machine (using the LightGBM library) performs the best. This model wins nearly every structured Kaggle competition (where the data is in table format) and we will likely need to use some form of this model if we want to seriously compete!)
Conclusions
This article and introductory kernel demonstrated a basic start to a Kaggle competition. It’s not meant to win, but rather to show you the basics of how to approach a machine learning competition and also a few models to get you off the ground (although the LightGBM model is like jumping off the deep end).
Furthermore, I laid out my philosophy for machine learning competitions, which is to learn as much as possible by taking part in discussions, building on other’s code, and sharing your own work. It’s enjoyable to best your past scores, but I view doing well not as the main focus but as a positive side effect of learning new data science techniques. While these are known as competitions, they are really collaborative projects where everyone is welcome to participate and hone their abilities.
There remains a ton of work to be done, but thankfully we don’t have to do it alone. In later articles and notebooks we’ll see how to build on the work of others to make even better models. I hope this article (and the notebook kernel) has given you the confidence to start competing on Kaggle or taking on any data science project.
As always, I welcome constructive criticism and discussion and can be reached on Twitter @koehrsen_will.