
Nasa Internship Report
Near Earth Asteroid Scout Attitude Control System Validation and Verification
Author’s Note: The following is a report of my work I completed while an intern at the NASA Marshall Space Flight Center (MSFC) in Huntsville, Alabama. This project was conducted in Winter/Spring 2017 with the Near Earth Asteroid Scout Control, Navigation, and Mission Analysis Team. [Numbers in brackets are citations that refer to references listed at the end]
Abstract
Near Earth Asteroid (NEA) Scout is a 6-unit Cubesat which will sail to an asteroid within one Astronomical Unit (AU) of Earth. Upon rendezvous with asteroid 1991 VG, NEA Scout will perform optical scientific observations in preparation for an eventual crewed expedition to an asteroid. NEA Scout is a solar sailing satellite, a unique class of spacecraft propelled primarily by the reflection of photons from an eighty-six square meter composite sail. In addition to optical data gathering and characterization of an asteroid, NEA Scout will demonstrate the feasibility of solar sailing technology for interplanetary missions. The Attitude Control System (ACS) for NEA Scout is composed of three primary actuators: Reaction Wheels (RW), the Reaction Control System (RCS), and an Active Mass Translator (AMT). The Guidance and Control (G&C) software which manages the ACS is developed in MATLAB and modeled using Simulink Block Diagrams and will be autocoded into C before being uploaded to the spacecraft. Before the code development can be completed, it must undergo extensive verification, to ensure that it satisfies all expected requirements, and validation, to assess if it fulfills the intended purpose. Validation and Verification (V&V) of the NEA Scout ACS consists of numerous smaller tasks that form part of the larger ongoing development effort. For each V&V step, scripts must be written, data must be gathered and analyzed, and changes need to be implemented based upon the results. Hardware sensors, including sun sensors, must also be tested both for accuracy and to ensure smooth integration with the complete ACS software. Validation and Verification is crucial to the development of a robust ACS in advance of final preparation of NEA Scout for launch on the Space Launch System (SLS) Exploration Mission 1 (EM-1) planned for 2018.
 Nomenclature
I. Introduction
The concept of sailing through the solar system propelled only by the momentum of the sun’s photons is not a new one. As early as the 1920s, the father of astronautics, Konstantin Tsiolkovsky, described using “tremendous mirrors of very thin sheets” to attain “cosmic velocities.” [1] The idea of propellantless space travel using solar sails has been an attractive method to overcome the limitations of a finite reaction mass and enable a wide range of missions throughout the solar system. As shown by James Clerk Maxwell in 1873, photons, though massless, have momentum and therefore exert pressure on a surface. Solar sails take advantage of the miniscule pressure of solar radiation by using massive, extremely thin and light sails that maximize the number of photons reflected. An ideal solar sail would be flat and completely specularly reflective as a photon that is reflected straight back from a surface will impart twice its initial momentum to the surface. This momentum is transferred to the spacecraft, and, over a large enough sail, and a long enough time period, substantial accelerations can be attained. Moreover, by controlling the angle of the sail normal relative to the sun (the Sun Incidence Angle or SIA), the sail attitude or direction is altered and the sail will gain or lose orbital momentum. This allows the solar sail to tack, sailing towards the sun, or turn outwards towards the outer reaches of the solar system[1]. Although solar sailing missions were investigated extensively by the Jet Propulsion Laboratory (JPL) in the 1970s as an opportunity to rendezvous with Halley’s Comet, it has not been until the past decade that solar sails have seen flight missions. The Interplanetary Kite-Craft Accelerated by Radiation of the Sun (IKAROS) launched by the Japanese Aerospace Exploration Agency (JAXA) in 2010[2] was the first solar sailing craft to make it into space followed by NanoSail-D launched by NASA in late 2010 [3]. In 2015, the Planetary Society launched Light-Sail 1 [4], and Light-Sail 2 is planned for liftoff on a Falcon Heavy in 2017.
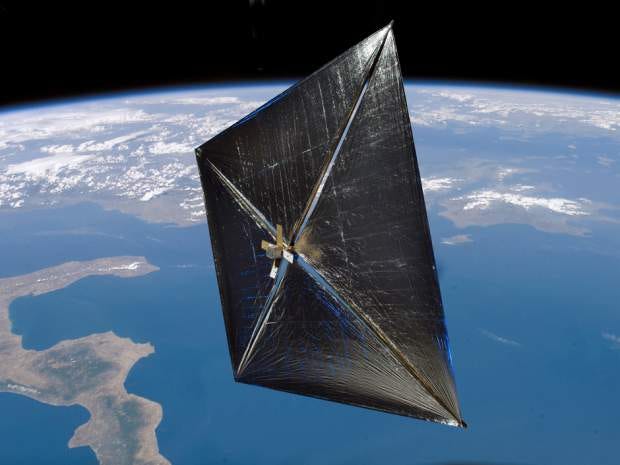
Near Earth Asteroid Scout (NEAS) is the latest iteration from NASA in this unique category of spacecraft. NEA Scout’s main objective is to sail to an asteroid within 1 Astronomical Unit (AU) from Earth and perform a close (<10 km) flyby [5]. NEA Scout is a 6-unit Cubesat and is approximately 30x20x10 cm in size. It weighs slightly over 11 kg and is designed based on the common Cubesat philosophy of utilizing Commercial Off-the-Shelf (COTS) parts. When the solar sail is completely unfurled (see left side of Fig. 1), it will be 86 m² although it is only 2.5 micrometers (µm) thick. The sail itself is composed of CP1 polymer with a 10 nanometer (nm) coating of aluminum on the front side (facing towards the sun) and an uncoated back side [6]. NEA Scout is viewed by NASA as a precursor to a potential crewed mission to an asteroid as well as a demonstration of the feasibility of using solar sails for interplanetary missions. The current target for NEA Scout is 1991 VG, although that is subject to change depending on the launch schedule. NEA Scout is expected to reach the asteroid after a 2–2.5 year journey and will fly by at a relative speed of 10–20 m/s. NEA Scout will fly on the first launch of NASA’s Space Launch System (SLS) Exploration Mission One (EM-1), and is one of thirteen secondary cubesat missions that will be launched from the Multi-Purpose Crew Vehicle Stage Adapter (MCA) [5].
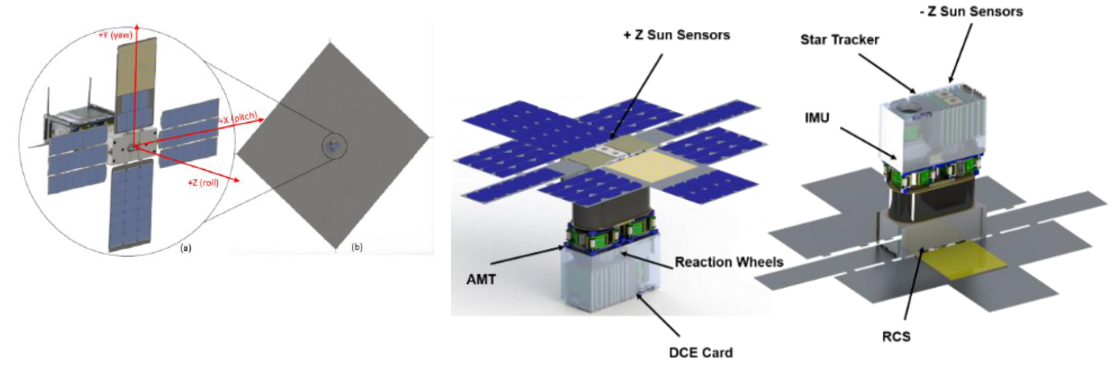 Figure 1. NEA Scout Overall and Hardware Schematics
The Attitude Control System (ACS) on NEA Scout is responsible for maintaining the correct heading (direction) of the spacecraft and is shown on the right side of Fig. 1. It is composed of three actuating systems: an Active Mass Translator (AMT), a Reaction Control System (RCS), and Reaction Wheels (RW). Each system has its own set of requirements and responsibilities. The RCS utilizes 6 cold gas thrusters and is tasked with managing the roll (z-axis) momentum of the RW, performing the detumble upon deployment from the SLS MSA, accomplishing the trajectory correction maneuver to put the spacecraft on the right initial path, and recovering from any unforeseen situations. The AMT manages the pitch and yaw (x-axis and y-axis) momentum of the RW by shifting the center of mass of the spacecraft relative to the center of pressure which alters the magnitude and direction of the moment produced by the solar force. The RW allow fine directional pointing for science, communication, and trajectory guidance. They change the attitude of the spacecraft by exerting a torque as they speed up. However, the RW have a maximum rate of 5000 rotations per minute (RPM)5000 which means that in certain situations they will need to be slowed down, or desaturated, by the RCS. The ACS also has a suite of sensors used to determine the state of the spacecraft. Three coarse sun sensors are used on detumble for sun pointing before the solar panels can be deployed to charge the batteries. After the initial phase of the mission, the start tracker will be used for accurate attitude data at low body rates. The star tracker is the primary sensor in terms of providing attitude and body rates for the mission after the sail has been deployed. Finally, an inertial measurement unit (IMU) provides body rate information during detumble and when relatively high body rates are expected. The IMU demonstrates more accurate performance than the star tracker at high body rates, but the rates are much noisier and require extensive filtering. Therefore, at lower body rates, the star tracker is the preferred sensor for determining the state of the spacecraft. The unique characteristics of solar sails, including high solar disturbance torques, low frequency flexible body effects, and a large moment of inertia with the sail deployed, make attitude control a challenge. [6] Therefore, extensive Validation and Verification (V&V) of the ACS is required in order to ensure that the system meets all requirements, can fulfill its intended mission purpose, and is robust against unforeseen states. Initial development and testing of the ACS has demonstrated that it can carry out the entire mission concept of operations under nominal conditions.
 Figure 2. NEA Scout G&C Simulink Model.
The Guidance and Control (G&C) software manages the ACS and is implemented as a series of MATLAB scripts and modeled using Simulink Block Diagrams as shown in Fig. 2. As MATLAB is a high-level interpreted language, it is too slow and unreliable to be uploaded directly to the spacecraft. Therefore, prior to being loaded onto NEA Scout, the MATLAB G&C software will be auto-coded into C. However, before development can be completed, the software must be validated to ensure that it can meet all requirements of the mission. The definition of software verification from the IEEE-STD-610 states: “the process of evaluating software during or at the end of the development process to determine whether it satisfies specified requirements.” [7] For NEA Scout, these requirements are derived from the mission objectives which determine the parameters needed by the ACS. V&V is intended to catch any errors in the code-base and test off-nominal scenarios. Rather than a single focused project, validation and verification is composed of a number of smaller steps that test a variety of situations and compare results to expected outcomes. V&V encompasses writing MATLAB scripts to test different phases of the mission, analyzing the resulting data to determine if requirements were satisfied, reporting the data to the G&C team, and implementing any changes based upon the simulation. This report details several studies which were undertaken in order to assess various aspects of both the G&C software and the ACS functionality. The main objectives were to test different phases of the mission and situations that could be encountered by the spacecraft, to ensure that the system was robust to off-nominal conditions, and to check that there were no unnoticed errors in the software that could result in a mission failure. In addition to working with the software simulation, this report also details testing of the sun sensor engineering development unit. This testing is also a crucial aspect of validation and verification because it characterizes the sensors for calibration purposes and tests that the sensors correctly interface with the software. The objectives of the sun sensor testing is ensuring that the data from the sensors is accurate and that it is correctly interpreted by the model to inform ACS actions. Each test documented in this report is independent, but also forms part of the larger process of G&C development for NEA Scout. The work documented here is but a small part of the entire process that goes into making a spacecraft a success. NEA Scout may be a small spacecraft, but it is a complex project with many people and independent entities working to ensure that its sailing mission will be a successful one.
II. Verification and Validation Analyses
1. Reaction Control System Manufacturing Variability Study
The Reaction Control System (RCS) on NEA Scout has five primary responsibilities corresponding to different phases of the mission. These duties are composed of initial spacecraft detumble, initial sun-pointing and attitude hold, the trajectory correction maneuver (TCM), reaction wheel z-axis momentum desaturation, and safe mode operation. [6] The RCS uses six cold gas thrusters for actuation with Refrigerant-236fa as the propellant. Two of the thrusters are situated axially and are only used during the TCM where they are fired continuously to provide the necessary delta-v to set NEA Scout on its course. The four non-axial thrusters will be used for attitude control and reaction wheel momentum desaturation during the remainder of the mission. The layout of the RCS is shown in Fig. 3.
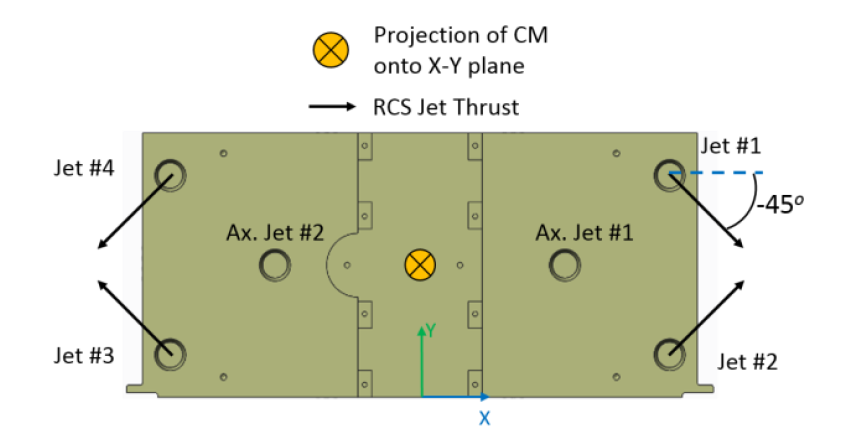 Figure 3. NEA Scout RCS Layout [6].
The critical responsibility of the RCS is the initial detumble of the spacecraft upon ejection from the Space Launch System Stage Adapter. All of the secondary payloads on SLS EM-1 will be launched, resulting in uncertain deployment conditions. It is expected that NEA Scout will be tumbling upon ejection with a maximum body rate of 10 degrees per second on each axis. The RCS must be able to null these angular rates to stabilize the spacecraft and perform initial sun pointing in order for the solar panels to be deployed to charge the batteries. The spacecraft carries only 1.25kg of propellant for the entire mission, and subsequently, the amount of propellant consumed during the detumble is a parameter of significance. Vacco, the manufacturer of the RCS cold-gas thrusters, can meet the design thrust magnitude requirements for each thruster within ±10%. This equates to 25 mN ± 2.5 mN (milliNewtons) of thrust for each thruster. Likewise, the angle (direction) of each nozzle is accurate to within ± 0.5˚[6]. The thrusters are oriented with both a clock (azimuth) angle of 45˚ relative to the x-axis, and an elevation angle relative to the xy-plane. Both of these angles on each thruster are subject to the same variability. The purpose of this study was to determine the effects of this manufacturing variability on the fuel consumed and the time to detumble.
The baseline fuel use for the detumble maneuver with the specified exact thrust magnitude and direction and starting with a 10 degrees/second rate on all three body axes was 1.389 grams. Similarly, the baseline time to detumble was 41.6 seconds. The time to detumble was calculated based on the time taken to null the body rates to less than 0.1 degrees/ second on each axis. The manufacturing variations in magnitude and direction were studied separately, with the objective of characterizing the worst case in each category. For the magnitude deviation, there were four anomalous cases identified which are summarized in Table 1. The performance characteristics of the case are summarized in the left half of the table while the right side shows the exact configuration of variability in each of the four non-axial jets. The fourteenth run had a fuel usage more than twice that of the baseline and was the most extreme case in terms of fuel usage. Although this is a large amount relative to the baseline nominal case, it was determined to be of no significant concern for the overall mission as the amount of fuel consumed was less than 0.25% of the total fuel available. Interestingly, several of the cases turned out have better performance than the baseline both in terms of fuel use and time to detumble.
 Table 1. Anomalous Cases Results from RCS Thrust Magnitude Variation Configuration.
Fig. 4 and 5 show the plots of time to detumble and the fuel usage for the four anomalous cases identified from the thrust magnitude variation study and summarized in Table 1.
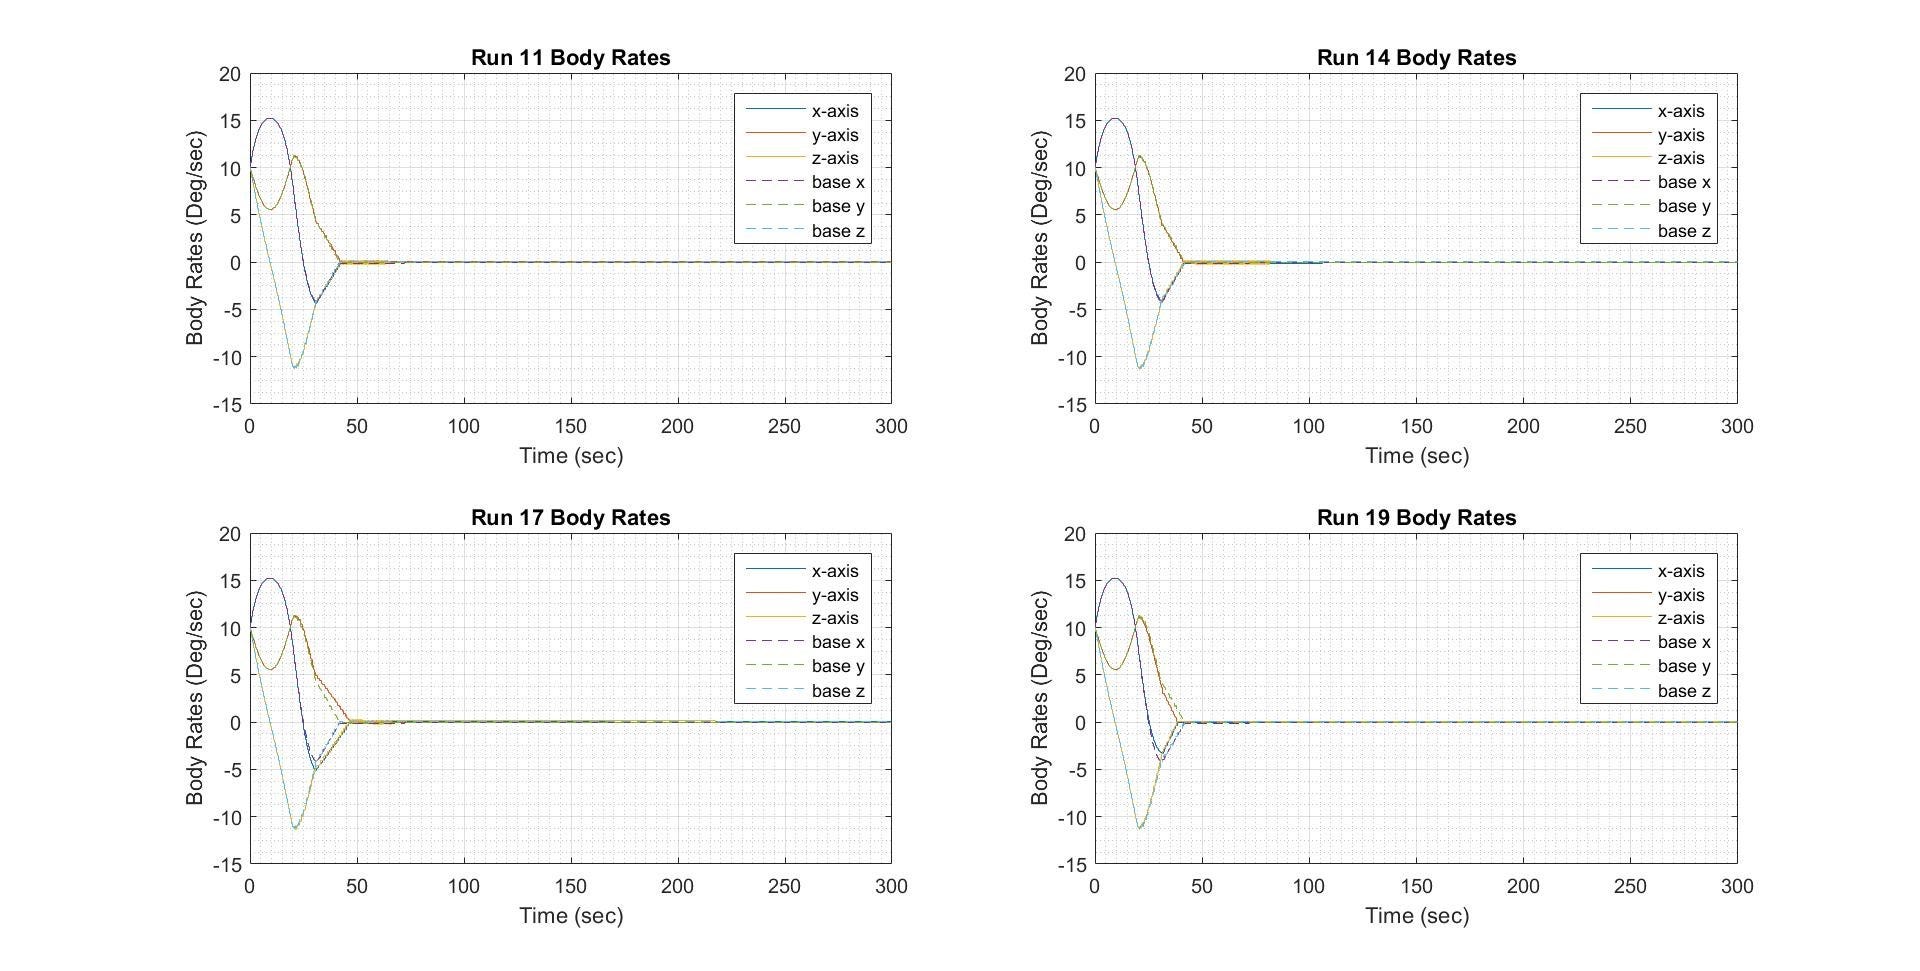 Figure 4. Time to Detumble Plots for Anomalous RCS Thrust Magnitude.
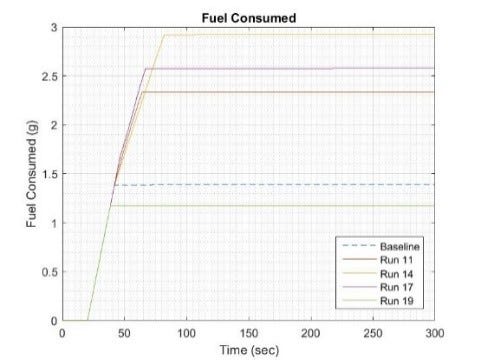 Figure 5. Fuel Use Plots for Anomalous RCS Thrust Magnitude.
The next step was to perform the same analysis but instead of varying the magnitude of the thrust, alter the direction of the four off-axial jets to model the variation specified by the manufacturer. Each of the jets had an uncertainty of 0.5˚ on both the elevation and azimuth angle. As before, the four most extreme cases were identified for further inspection. These cases are summarized in Table 2.
 Table 2. Anomalous Cases from RCS Thrust Direction Configurations.
The worst case in the direction variation configuration used almost three times the fuel use of the baseline case, but again, the total fuel used was judged to be inconsequential for the overall mission especially as the detumble is a one-time event. The conclusion from the thrust magnitude and direction manufacturing variation study is that the manufacturing tolerances will allow for a satisfactory detumble even under the worst case scenario deployment of 10 degrees/second on each body axis. Although the fuel usage could be up to three times greater than the baseline depending on the exact configuration of the variation, this was determined by the G&C team to be within acceptable levels for the one-time detumble maneuver. The total fuel usage for even the worst case was under 0.5% of the fuel budget for the mission. Even with a worst case manufacturing variation, the effects for the entire mission would be minimal and all objectives could still be accomplished. Further work in the area of hardware variability could include accounting for both the angle variation and the thrust variation of the thrusters in the same run. Based on the preliminary work, this was deemed unnecessary because none of the initial cases were severe enough to impact the mission. However, the hardware variation for the RCS and other systems could potentially impact other areas of the mission concept of operations and should be investigated in order to implement any corrections that could mitigate or overcome decreased performance.
2. Modeling Effects of Specular Reflectivity on Thrust
Light incident upon a surface, can be either reflected, absorbed, or transmitted. The light that is reflected can be further categorized as being either specularly reflected or diffusely reflected. Specular reflection refers to when the reflected light ray has the same angle relative to the surface normal as the incident light. Diffuse (Lambertian) reflection on the other hand, is when the reflected light rays is scattered and leaves the surface at an angle different from that of the incident ray [8]. These two definitions are summarized in Fig. 6.
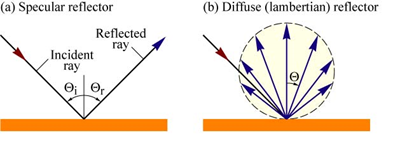 Figure 6. Specular and Diffuse (Lambertian) Reflection.
The symbol s is called the specular reflectivity coefficient and represents the fraction of reflected light that is specular. It is a crucial material property that greatly influences both the magnitude and direction of thrust that a solar sail is able to extract from solar radiation pressure. As the specular reflectivity coefficient decreases, the diffuse reflection increases and the solar sail will experience a greater force in the plane of the sail, resulting in a larger torque [1]. The torque resulting from the force of the sun’s photons is called a solar torque. This solar torque must be managed by the attitude control system in order for the spacecraft to remain oriented correctly. The solar torque generated on the x-axis and y-axis is handled by the Active Mass Translator (AMT). This actuator shifts the spacecraft center of mass relative to the center of pressure and is therefore able to trim the torques from the order of micro-Newton-meters (mNm) to tens of nano-Nm. The torque about the z-axis is known as the roll or “windmill” torque and must be controlled by the RCS using a minimal, but non-zero amount of fuel. Consequently, it is of great interest to the guidance and control group to characterize the solar torque as a function of the specular reflectivity coefficient. Although this value is a material property, for a given material it can change depending on the extent of deformation of the material. For a solar sail, this deformation occurs in the form of wrinkles. There are three categories of wrinkles that occur in a solar sail the size of NEA Scout; macro-, meso-, and microscale. Wrinkles on the order of a meter to centimeters (1 –0.01 meters) are labeled macro scale and can be effectively modeled in structural finite element models (FEM) such as that created for the NEA Scout G&C software model. Wrinkles on the microscale, or those smaller than 10s of micrometers (10–6 meters), can be considered a material roughness and thus the effects on the sail optical characteristics are captured by the Bidirectional Reflectance (BDRF) test. However, wrinkles in the middle size category, considered meso-scale (millimeters to tens of micrometers, 10–3–10–5 meters), cannot be accurately modeled using either material characteristics or an FEM. As shown by Heaton et al. [8] these wrinkles must be taken into account through the alteration of the specular reflectivity coefficient as the wrinkles effectively increase the diffuse reflection of the solar sail material.
The first characterization of the specular reflectivity coefficient was completed at the Jet Propulsion Laboratory as part of the preparation for the proposed Halley’s Comet mission. These tests were conducted on pristine samples and later research performed in 2015 lowered the specular coefficient from 0.94 ± 0.04 to 0.89 ± 0.045. [8] However, more recent testing on larger 10 cm² samples of the sail material used for NEA Scout has shown that the specular reflectivity coefficient for a full-scale solar sail upon deployment will be even lower. [8] Furthermore, the coefficient can vary widely across the sail because the meso-scale wrinkle distribution is highly non-uniform even when unfurling the sail in a controlled test environment. Testing performed at MSFC observed values for the specular reflectivity coefficient that ranged from 0.804 to 0.300 across samples from the sail. This is a significant cause for concern as this value determines the magnitude and direction of the solar force experienced by the sail which in turn affects spacecraft performance, from the characteristic acceleration to the solar torques. The default value for the specular reflectivity coefficient in use in the development of the MATLAB and Simulink model was 0.89. The purpose of this study was to characterize and describe the effects of changing the value to a more realistic value provided by recent full-scale sail tests.
The ideal optical model of the force on a solar sail comes from the Jet Propulsion Laboratory and was published in McInnes [1] and Wright [9]. The equations governing the tangential and normal force are described as follows:
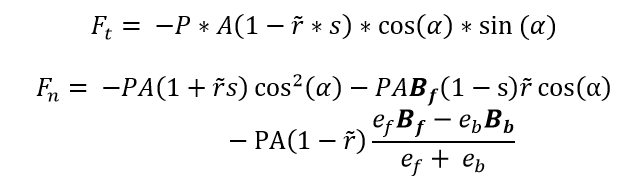 Equation 1: Tangential Force on Sail ; Equation 2: Normal Force on Sail
where the terms in Eq. (1) and (2) are defined in the nomenclature. Eq. 1 describes the force tangential to the plane of the sail and Eq. 2 describes the force normal to the plane. The specular reflectivity coefficient is given as s and is a crucial variable in both equations. As s decreases, the sail experiences a greater force tangential to the plane of the sail and therefore receives greater solar torques. After some deliberation, it was decided that the majority of cases for the investigation should be run with a coefficient of 0.563 and 0.444. The cases would be run with a single value of s across the entire sail and these were judged to be the lowest realistic effective average values for the entire sail of NEA Scout.
The modeling study on the ramifications of altering the specular reflectivity coefficient had two phases: first, an optimized standalone thrust model developed [8] for the G&C simulations was used to characterize the levels of force and torque experienced by the sail for a selection of specular reflectivity coefficients across a range of sun incidence angles (SIA). Once the effects had been described in an ideal model, the specular reflectivity coefficient changes would be implemented across the entire MATLAB model in order to see if the attitude control system would be able to handle the resulting solar forces and torques (torque is used interchangeably with moment). The results of running the sail model in the stand-alone thrust model are shown in Fig. 7 and 8. Changes in the specular coefficient do not significantly impact the magnitude of the force but the magnitude of the solar torque is substantially altered. Here, the magnitude of the force is defined as the norm of the tangential and normal forces and the magnitude of the moment is defined as the norm of the x, y, and z moments.
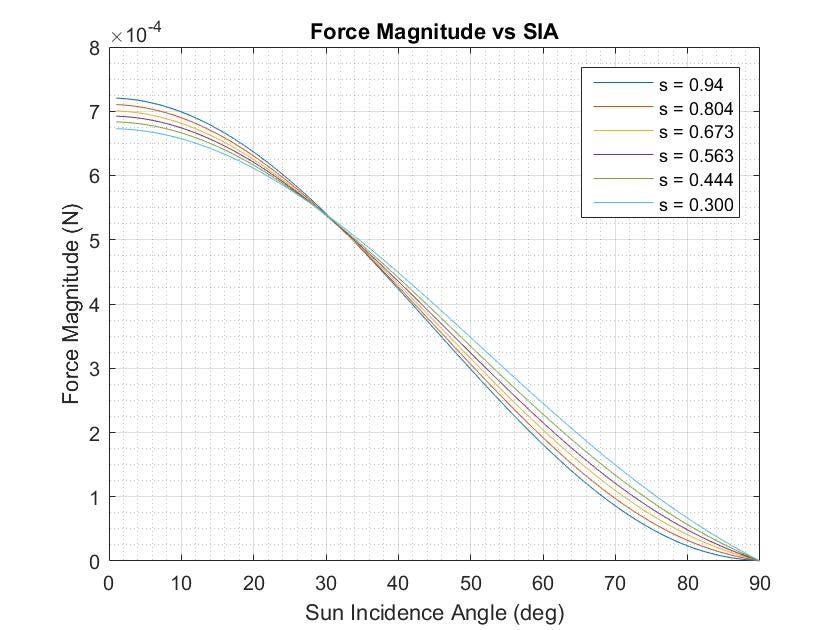 Figure 7. Magnitude of Force vs SIA for Varying Values of the Specular Reflectivity Coefficient.
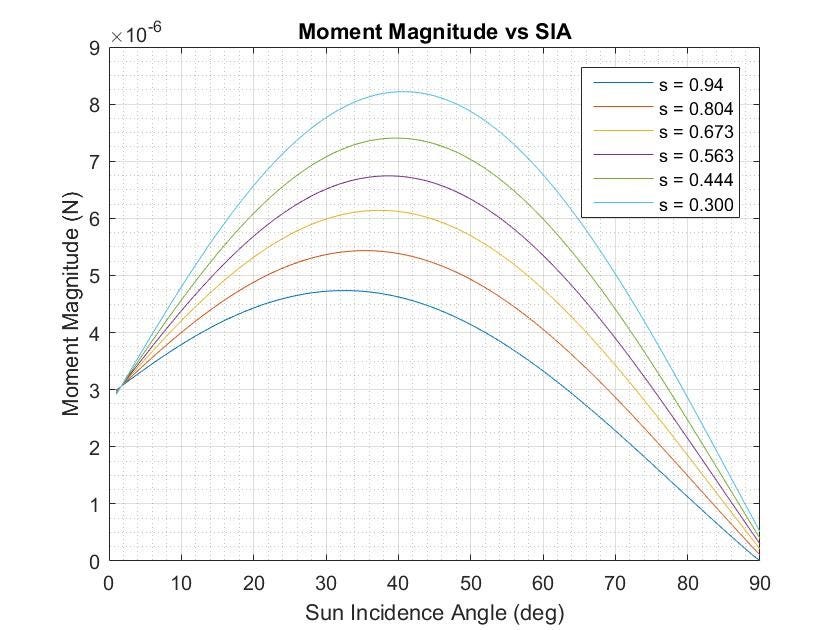 Figure 8. Magnitude of Force vs SIA for Varying Values of the Specular Reflectivity Coefficient.
The worst case from the first phase of the study corresponds to the lowest specular coefficient as expected and is characterized by the greatest solar torques across the range of SIA. After completing the preliminary studies in the stand-alone thrust model, the variation in specular reflectivity was implemented in the full simulation. The script used to test the effects of the variation in thrust and moment was a simple attitude hold script that attempted to maintain the same attitude of the sail over the entire length of the simulation. In the full simulation, the roll angle (clock angle) of the sail was set at 0˚ and the sun incidence angle was increased until the attitude control system could no longer manage the solar torque. Fig. 9 shows the main scope from a simulation run with a specular reflectivity coefficient of 0.563 and a sun incidence angle of 55˚. As can be seen in the lower right plot, the Active Mass Translator (AMT) does not run into its limits which are at 3.5 cm on the y-axis and 8 cm on the x-axis. The x-axis and y-axis momentum of the RW can be successfully managed under these conditions by the AMT and will not require the RCS jets to fire to desaturate the wheels.
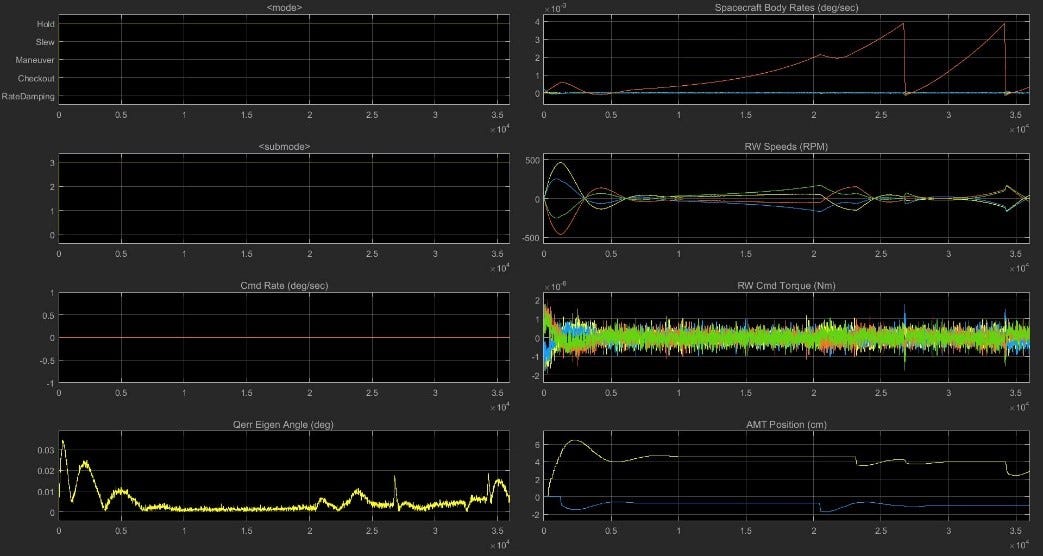 Figure 9. Summary of Simulation with s = 0.563 and SIA = 55˚
In order to quantify the effects of changing the value, the maximum SIA for which the AMT could manage the x-axis and y-axis momentum was determined for both the case with s = 0.563 and s = 0.444. With a coefficient of 0.444, the maximum SIA was 45˚ while at a coefficient of 0.563, the maximum SIA that could be tolerated was 55˚. The maximum nominal SIA for the mission is 50˚, and therefore, even with the worst feasible specular coefficient, the AMT should is able to handle the resulting solar torques across nearly the entire range of SIA. When the AMT cannot handle the momentum of the wheels, the RCS is forced to fire to desaturate the wheels and manage the x-axis and y-axis momentum in addition to its nominal duty of managing the z-axis momentum. The conclusion that was drawn was that even accounting for a significant decrease in the specular reflectivity coefficient, the RW x-axis and y-axis momentum should be adequately managed by the AMT for nearly all expected operating angles of the spacecraft. Further work in this direction should include an attempt to characterize the optical properties of the entire sail. Due to the size and the delicacy of the sail, testing the entire sail on Earth has not been feasible. Currently, testing [8] has been carried out on 10 cm² pieces of the sail, which is a significant size difference from the full sail at 86 m². Even with this small sample, the optical properties varied widely across the sample because of the distribution of wrinkles. It is clear from this current study that the optical properties of the sail can have a large effect on the performance of the mission. Although this study did not identify any significant reasons for concern for the NEA Scout mission, this is an area that has been difficult to accurately characterize and more research is needed in preparation for future solar sailing missions. Ideally, optical data can be gathered from NEA Scout when it is deployed on orbit that will help advance the state of specular reflectivity knowledge. The greatest limitation currently confronted by solar sails is the lack of flight experience, and any flight data gathered by NEA Scout will prove invaluable to the nascent province of solar sailing.
3. Passive Roll Control
Although NEA Scout utilizes the propellantless method of solar sailing for primary propulsion, like all other spacecraft, it is still operationally limited by the amount of propellant it can carry because of mission critical functions that still must be carried out by the RCS. Therefore, any potential method for reduction of fuel use is attractive to the mission. One such area that holds promise for reducing or even eliminating fuel consumption is that of passive rol control. The current concept of operations specifies that the x-axis and y-axis momentum of the reaction wheels is managed through the use of the AMT and the z-axis (roll) momentum is managed by the RCS. The RCS will also be commanded to fire if the speed of the wheels crosses a pre-determined threshold as may occur when the AMT alone cannot manage the solar torque. A worse case estimate [6] of fuel consumption used by the RCS to manage the roll momentum for the entire mission is 240 grams (out of 1.25 kg total for the mission). Even though this fuel use is accounted for in the nominal mission plan and will not affect the primary objectives, any reduction in this value will add margin for unplanned circumstances and could open up the possibility of extending the mission to visit another celestial body. Consequently, one area of research for NEA Scout is propellantless z-axis (roll) momentum management. The roll torque experienced by the spacecraft is a function of both the roll and SIA. At SIA larger than 20˚, there is a zero crossing in the roll torque at certain roll angles as illustrated in Fig. 10. For a given SIA above 20˚, there is at least one roll angle at which the solar z-torque is zero. If the solar sail can achieve this angle at a low enough roll rate, the sail should “catch” at the angle, that is, the sail would oscillate about that roll angle rather than continue to roll around the z-axis and build up momentum. These equilibrium points occur where the slope of the torque vs roll angle plot is negative and where the roll torque crosses zero. This occurs at clock angles of near 0˚ and near 180˚ as demonstrated in Fig. 10.
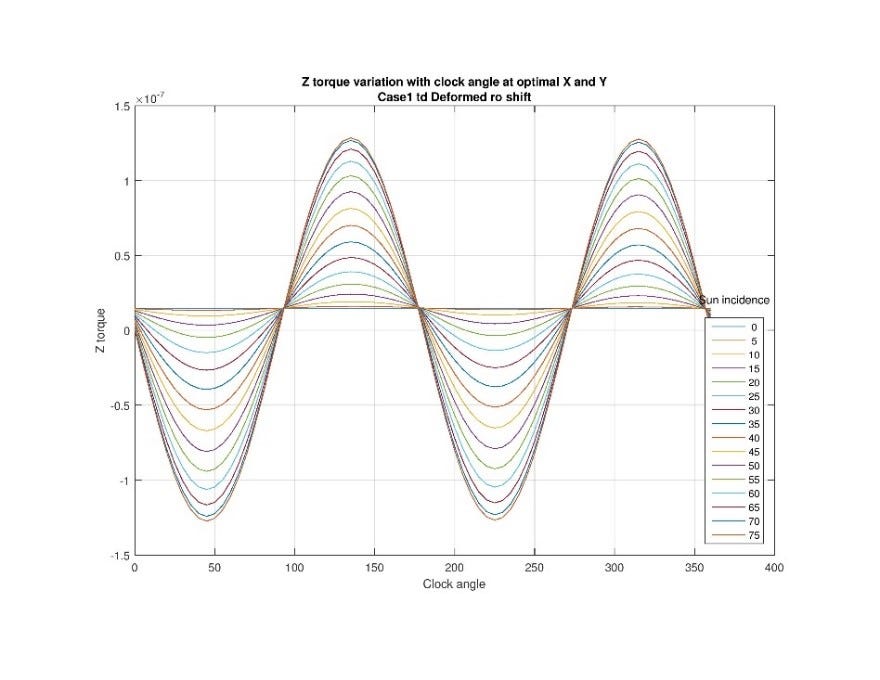 Figure 10. Roll Torque by Roll Angle and Sun Incidence Angle at Optimal AMT X and Y Position.
At these stable points, the sail will oscillate about equilibrium and over a long enough time frame, the magnitude of the oscillations would decay due to structural damping. This process could also be sped up with an additional energy sink. [6] The objective of this study was to determine the initial roll angles (used interchangeably with clock angles) that allow the sail to reach a stable oscillation point for a given SIA. The designated approach was to first explore the problem in a stand-alone passive roll control model, and then move on to modeling the situation in the full simulation. Table 3 shows a summary of results for a subset of the different angle combinations which were run.
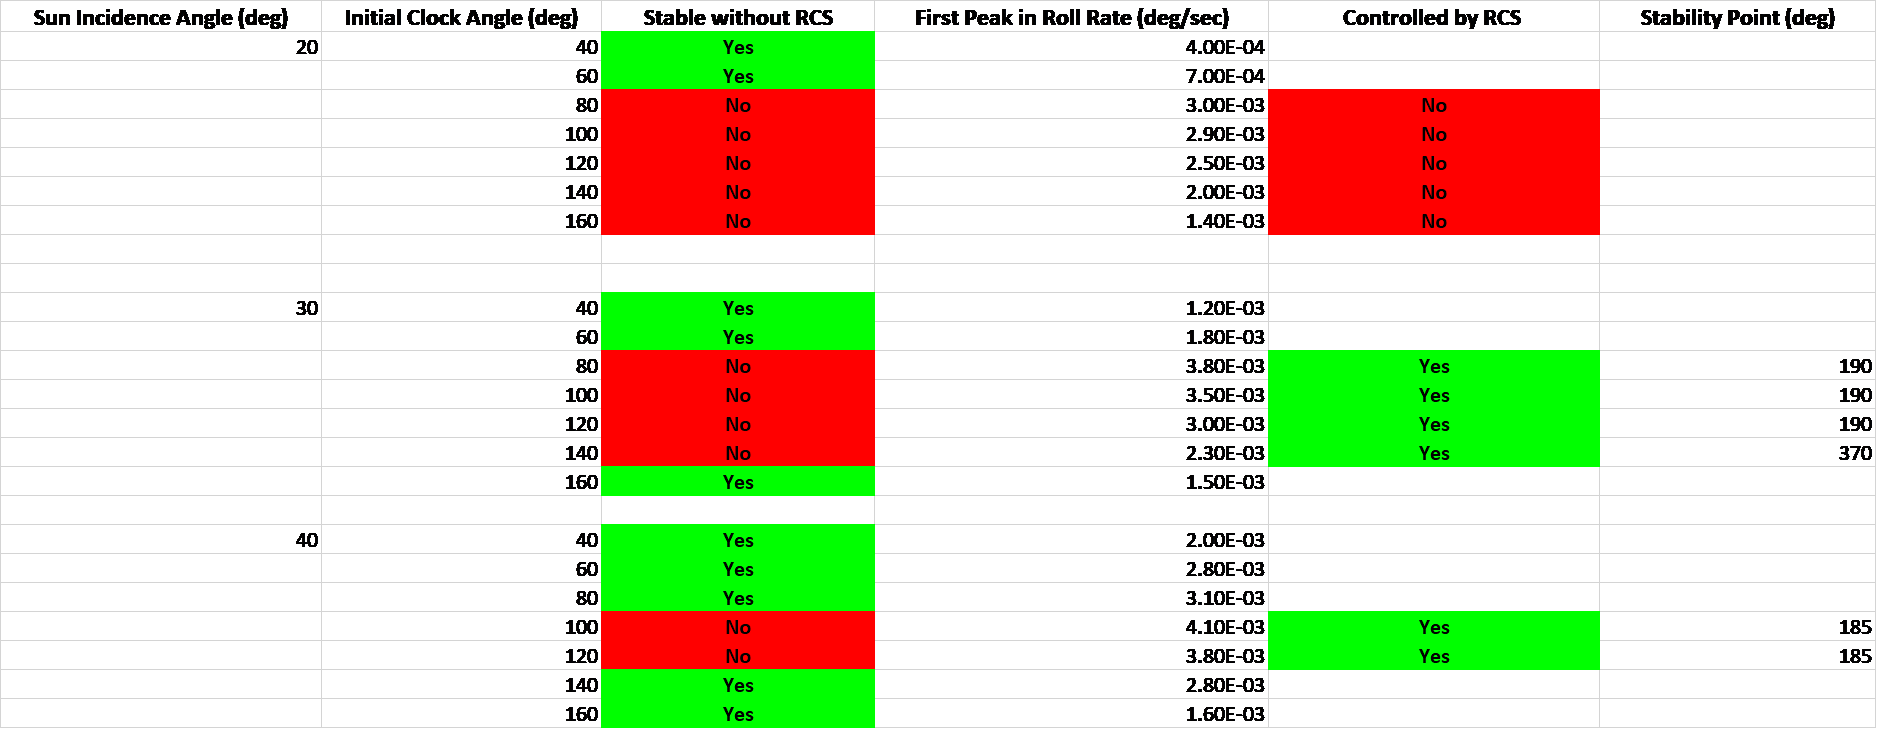 Table 3. Summary of Passive Roll Control Cases.
The preliminary work demonstrated that depending on the SIA and the starting roll angle, the sail could reach a stable point without the use of the RCS. Fig. 11 demonstrates the attainment of a stable oscillation angle.
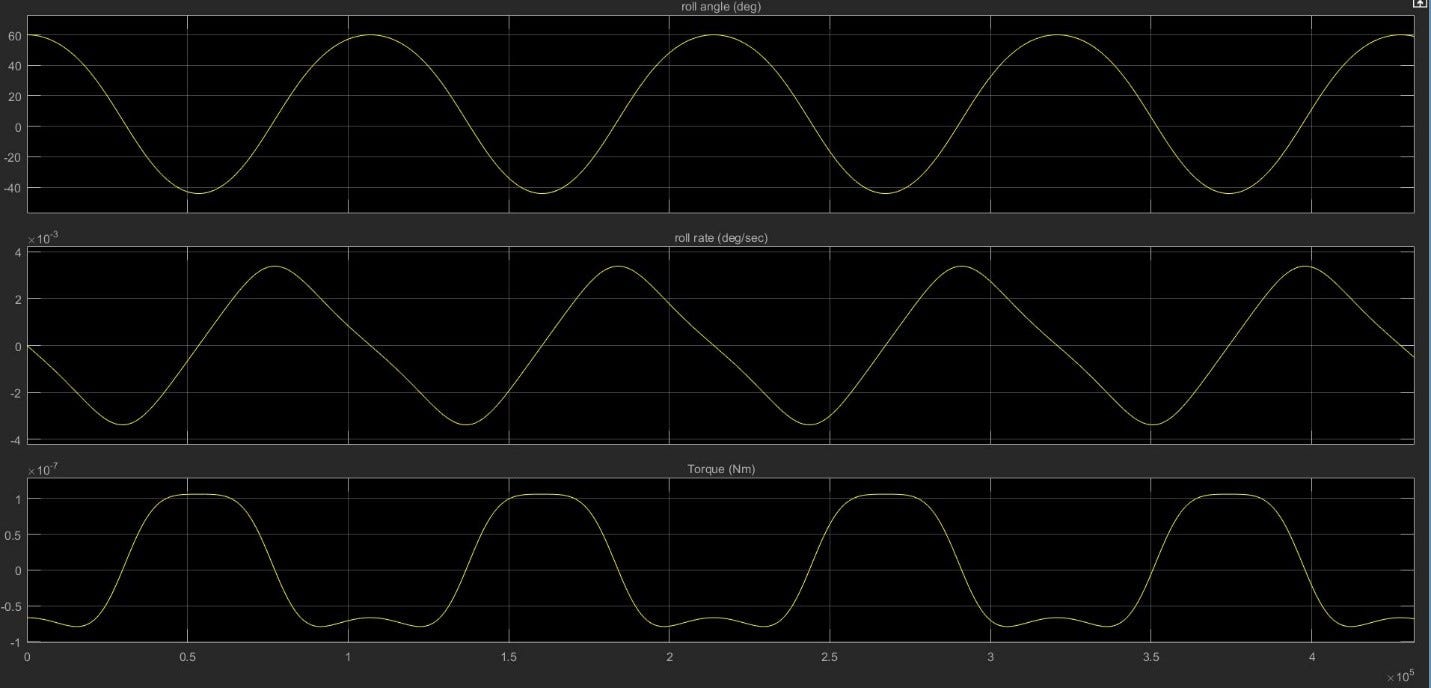 Figure 11. Passive Roll Control with SIA = 20˚ and Initial Clock Angle = 60˚.
The top plot in Fig. 11 shows that the sail oscillates about a roll (clock) angle of 20˚ indefinitely. In the unstable cases by contrast, the roll angle continues to grow over time without bound and the spacecraft spins about the z-axis until the RCS must fire to control the RW momentum. After categorizing the cases into stable and unstable, several trials were then run in the entire simulation, in order to verify the results and look for unexpected results that may not have manifested in a simplified model. A further investigation was conducted to determine if the unstable cases could be stabilized using the RCS. The problem in the unstable cases is that the sail begins at an initial roll angle where it is subjected to significant z-axis torques. Therefore, when the sail reach the zero crossing in the roll torque graph, the sail already has too much momentum to be “caught” at a stable point and continues spinning and gaining momentum. To resolve this issue, the hypothesis is that the RCS could fire for a minimal amount of time and coerce the solar sail into a specified roll angle about which the sail would be stable. To test this hypothesis, an unstable case was run with the RCS activating above a body rate threshold of 3 x 10⁻³ deg/sec on any of the body axes. The initial conditions were SIA = 30˚ and initial clock angle = 100˚ which had been verified as an unstable case in the full-scale simulation. The results of this examination are illustrated by the main summary in Fig. 12.
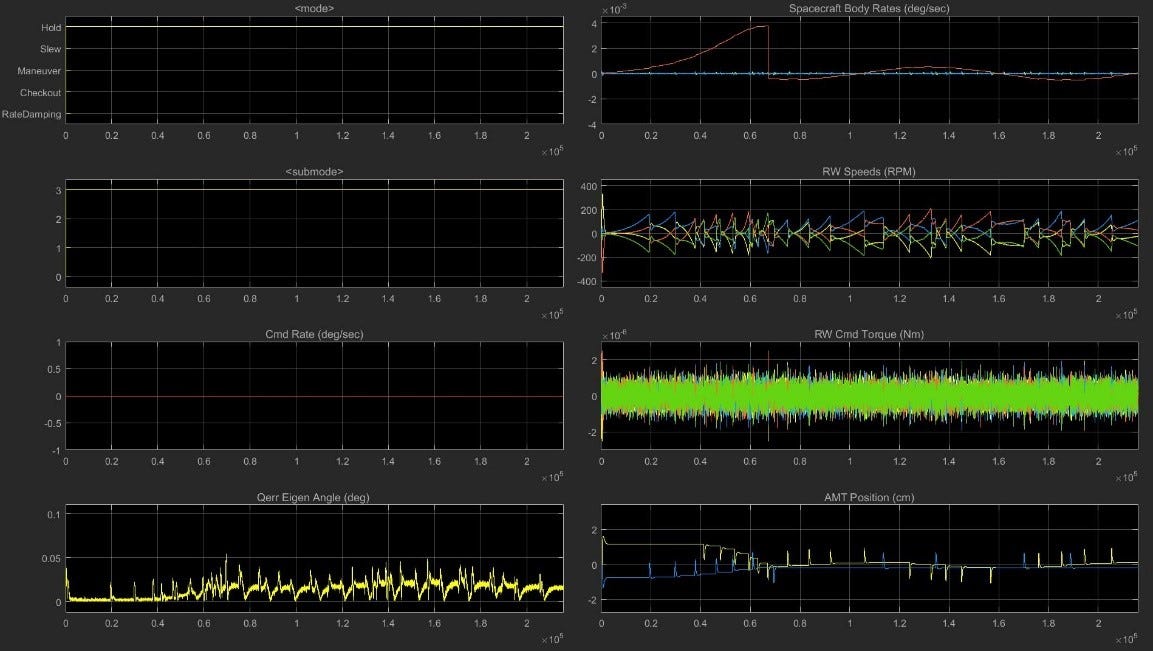 Figure 12. Summary of Unstable Case with RCS Activated.
Of primary interest in Fig. 12 is the plot in the upper right corner showing body rate vs time (the y-axis scale is in 10^-3 Nm and the x-axis scale is in 10⁵ seconds). The sail spins about all three axis with an initially increasing body rate on the z-axis as indicated by the red line. After the body rate crosses the threshold for RCS activation, the RCS fires and nulls the body rate on this axis at around 0.7 x 10⁵ seconds. After this point, the sail is caught around a stable point and the body rates on all three axes remain below the threshold. This indicates that rather than continuing to spin about the z-axis, the sail has is oscillating about a stable point. Moreover, for the rest of the simulation, the RW speeds remain well below the 5000 rpm saturation limit and the AMT does not come close to reaching its limits. Overall, the test demonstrated that a stable point could be reached from an initially unstable configuration using the RCS. While the RCS would consume propellant to initially induce the sail into this stable point, the overall fuel usage for this situation would be less than having the RCS continually fire to desaturate the z-momentum of the RW. In conclusion, this study proved that at least in the full-scale model of NEA Scout, passive roll control is a feasible option for managing the z-axis momentum. If a stable point can be reached either with or without the assistance of the RCS, the sail will oscillate about one clock angle and the RCS will not be needed to desaturate the reaction wheels resulting in lower fuel usage and increasing the mission possibilities.
4. Reflectivity Control Device (RCD)
A promising proposed technology for propellantless attitude control is that of reflective control devices (RCD). The amount of force imparted on a surface by solar radiation pressure is proportional to the reflectivity of the surface as shown in Eq. 1 and 2. The concept of an RCD is that by altering the reflectivity of small areas of a solar sail, the force exerted on that region would be changed and a torque could be generated that could be used to orient the spacecraft as required. A region of the sail that is more reflective will generate a larger force that an equal sized area that is less reflective all other factors being equal. [1] The method examined in this study calls for each RCD to be composed of two regions, which are placed on opposite ends of one of the sail booms (support beams for the sail). The proposed design further specifies two RCDs on the sail which results in a total of four areas, one on each of the tips of the booms. By altering the reflectivity of one area in each pair, there will be a difference in forces exerted on the two areas making up the RCD. The torque is then this difference in force times the moment arm of the areas to the x-axis or y-axis. A schematic is presented in Fig. 13 although this design specifies eight RCDs, with four situated vertically and four situated horizontally. [10]
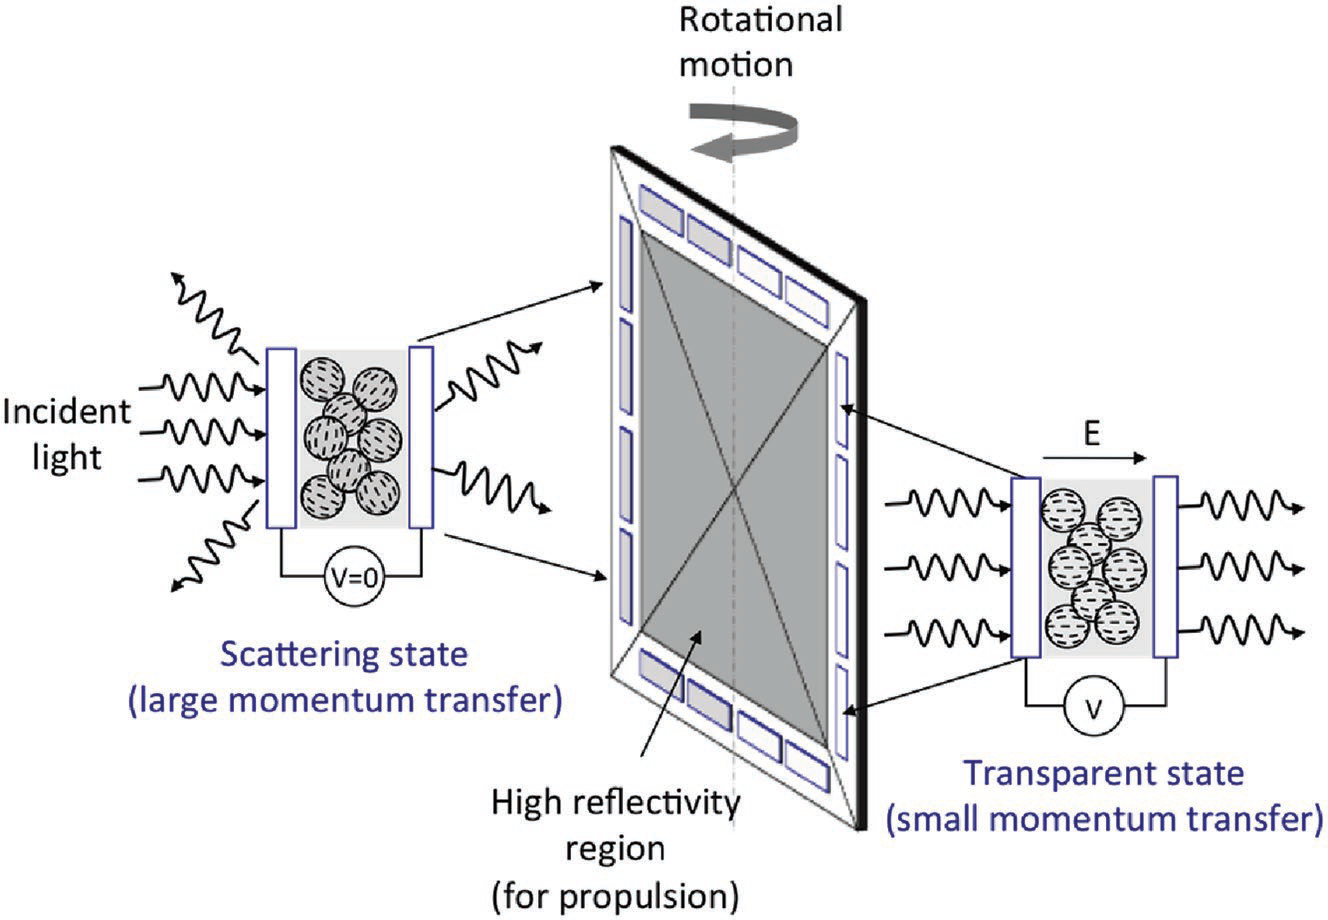 Figure 13. Reflectivity Control Device for a NEA Scout-Type Mission [10].
The method of altering reflectivity for attitude control was successfully demonstrated by the Japanese Aerospace Exploration Agency (JAXA) IKAROS solar sailing spacecraft launched in 2010 [2]. This was the world’s first validation of interplanetary solar sailing, and featured several novel techniques which had yet to be implemented including RCDs. On ICAROS this took the form of flexible multi-layer sheets placed around the sail that transitioned from diffuse-dominant reflectance to specular-dominant reflectance. The sheets are composed of liquid-crystals, and when a voltage was applied, the sheet became more reflective and hence has a higher specular coefficient and generates more force from the solar radiation pressure. When the voltage is removed, the sheet is rendered opaque and the reflection is dominated by diffusion lowering the force. By manipulating the cycling of these patches, the entire spacecraft attitude could be controlled [2]. A picture of IKAROS with the RCDs labeled is shown in Fig. 14
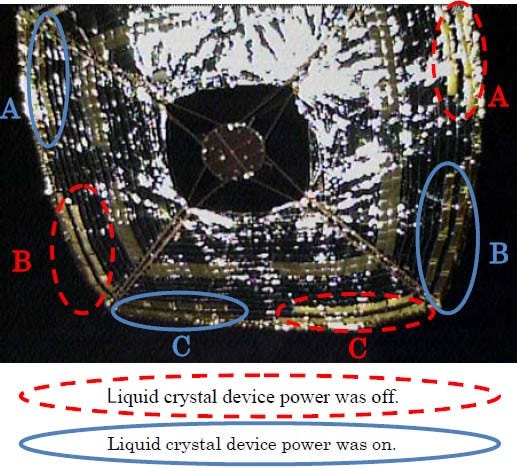 Figure 14. IKAROS on Orbit Showing RCDs.2
The concept under consideration for this study is the same as that of IKAROS although the implementation varies slightly with the two RCDs being placed at the four corners of the sail rather than along the edges as for the Japanese spacecraft. A further difference is that for the present study, when the voltage is off, the panels are opaque and when the devices are turned on, the RCD panels become transparent. Thus, the panels transition from diffuse reflection when off to transmission when on and generate a torque from the difference in force experienced by each panel [10]. The center of the sail remains the same CP1 polymer coated with aluminum for greatest reflection of the photons and the maximum thrust.
Although it is too late in the timeline for NEA Scout to be equipped with RCDs, the current study was performed on a NEA Scout-like solar sail to gauge practicality for future missions. MSFC is currently working with researchers at the University of Maryland for the development of the films used in the RCDs. The researchers at Maryland [10] use polymer dispersed liquid crystal (PDLC) film as the altered material. These films can be easily switched from opaque to transparent and have been implement in flat panel displays and smart windows including the Boeing 787 Dreamliner windows which can be electronically dimmed. [11] Research conducted at the University of Maryland has focused on characterizing the optical properties of these PDLC films for use in RCDs. The primary figure of merit for the RCDs is the change in the fraction of incoming photon momentum absorbed when the device is switched off versus when it is switched on. The maximum fraction of momentum that can be transferred to a sail from a photon is 2.0 if the photon is specularly reflected. On ICAROS, the fraction of momentum transferred when the device was switched on was 1.51 and when the device was switched off it dropped to 1.40 as the reflection became more diffuse. The PDLC investigated at the University of Maryland has a fraction of momentum transfer of 0.43 when on and 0.93 when off for a difference of 0.50 [10]. As the difference in the fraction of momentum transferred increases, the force difference between the regions increases and therefore the torque available for controlling the sail increases in step. Work completed thus far at the University of Maryland has characterized the PDLC films based on the thickness of the film and yielded data for the energy usage, weight density, and difference in fraction of momentum transferred for several different thicknesses. In order to determine the feasibility of PDLC RCDs for a NEA Scout-size solar sail, the raw numbers provided by the researchers for the PDLC film needed to be translated into a control torque produced by a reaction control device. This could be accomplished by taking the fraction of momentum transferred provided by the researchers and calculating the control torque that would be generated as a result. The torque produced by a single RCD can be calculated using Eq. 3:
 Equation 3: Torque Due to Solar Pressure
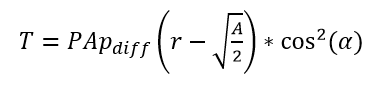
where T is the torque in Nm, P is the solar radiation pressure at 1 AU (4.52E-06 N/m²), p_diff is the difference in the fraction of momentum transferred when the device is off versus on, r is the length of the sail boom in m, A is the total area of the RCD in m², and α is the sun incidence angle of the sail in radians. This is a simplified version of the thrust equations presented in McInnes [1] and Wright [9] and is valid for a flat plate. For a preliminary estimate of the feasibility of the technology, this calculation was deemed acceptable. The results of the study are presented in Table 4.
 Table 4. PDLC Thickness Performance Properties.
The required area was derived based upon the area needed to generate a control torque of 5 x 10^-6 Nm, considered the largest solar torque that will be encountered during the NEA Scout mission. The difference in momentum transfer declines as the thickness of the PDLC decreases which results in a larger area requirement to achieve the torque. However, the thinner PDLC films have a reduced power and weight density meaning even though they may need to be larger in size to meet the requirements, the mass and power consumption is reduced compared to thicker films. The Area Required and Mass of the RCD vs PDLC thickness is shown in Fig. 15. From the initial calculations, the power, weight, and area requirements were deemed to be on a feasible order for a NEA Scout size solar sail.
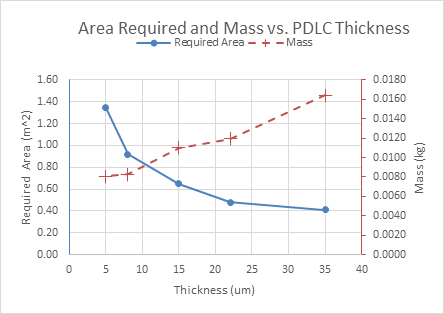 Figure 15. Area Required and Mass of PDLC versus Thickness.
If the RCD is placed flat against the plane of the sail, it will only be able to generate a change in the force that is normal to the surface of the sail which would limit the device to creating control torques about the x-axis and the y-axis. In order to generate a z-axis torque, a force must be created by the RCD tangential to the sail or in other words, in the plane of the sail. The solution derived is to place the RCD at an angle to the plane of the sail. This angle, defined as the actuator angle, is positive for a counterclockwise rotation and is the angle between the plane of the sail and the plane of the PDLC film. The next step of the study was therefore to calculate the ideal angle for the actuator that will allow for the maximum control torque about the z-axis across the widest range of SIA. Calculating the control torque from the introduction of an actuator angle is done by modifying the cosine squared term in Eq. 3 as shown in Eq. 4:
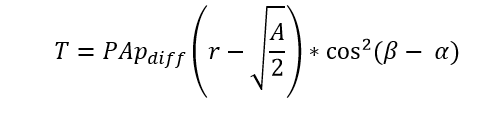 Equation 4: Control Torque from RCD
where β is the actuator angle in radians. This equation yields the control torque about the z-axis, or the roll control torque. This equation can then be plotted for several actuator angles across a range of sun incidence angles as shown in Fig. 16.
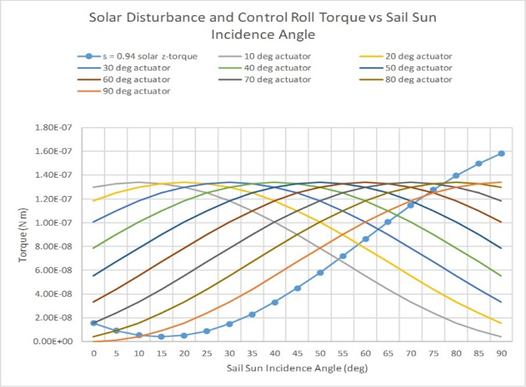 Figure 16. Control Roll Torque vs Sun Incidence Angle by Actuator Angle of RCD.
The majority of actuator angles generate a control roll torque greater than the solar disturbance torque across nearly the entire range of sun incidence angles. The maximum sun incidence angle expected under nominal mission conditions is 50˚, and thus, the RCD would be an effective means for controlling the roll torque. The best candidate was selected as the 40˚ actuator angle because this resulted in a control roll torque greater than the solar disturbance torque across the range of anticipated sun incidence angles. Moreover, as the actuator angle is increased, the force normal to the plane generated by the RCD will decrease. An RCD with an actuator angle of 90˚ would generate no normal force and could not control the x-axis and y-axis torque, and 40˚ was a compromise between normal and tangential forces or between in-plane (x-axis and y-axis) and out-of-place (z-axis) control torque.
The final step in the study was to calculate the control torque generated by a pair of RCDs. The preliminary work was carried out accounting for a single RCD with the two regions placed on opposite corners of the sail. The design specifies that an actual implementation would most likely have two pairs of RCDs placed on the four sail corners. The actuator angle used in these calculations was 40˚ and the RCDs magnitude of control torque was calculated for across the range of SIA and for several difference roll angles. The resulting magnitude of the control torque (the norm of the torque on all three axes) is shown in Fig. 17 along with the solar disturbance torque. The x-axis is a range of sun incidence angles while the different shaded lines represent the clock angle of the sail.
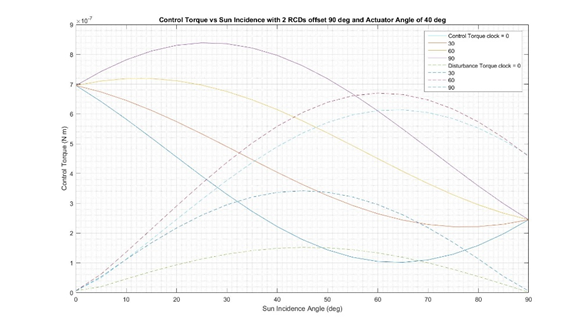 Figure 17. Control Torque vs Sun Incidence Angle with 2 Pairs of RCDs at Actuator Angle of 40˚.
Overall, the graph and associated numbers proved that the RCD set-up as specified for the current study works across the majority of sun incidence and clock angles. The magnitude of the control torque is greater than the disturbance torque across nearly all the expected sun incidence angles and at most roll angles. The conclusions of this work was that RCDs composed of PDLC films would be both practical and effective for a solar sail of NEA Scout’s size. Using the thickest PDLC film, each RCD would need to be 0.411 m² and would consume 1.86 Watts of power with a weight penalty of 0.0164 kg. The total power consumption would thus be slightly over 3.6 watts and the total weight would be slightly more than 30 grams accounting for only the PDLC films. To give a sense of scale, the total battery capacity on NEA Scout is 48 watt-hours. With peripherals, including wiring and the electrodes needed to apply the voltage, the total weight of the devices would be expected to be less than 100 grams compared to a total weight for NEA Scout of over 11 kg [6]. Based on this work, RCD devices would be feasible on a NEA Scout platform. The total penalty to weight and power would need to be considered, but the ability to control the attitude of the sail without expending propellant makes the reflective control device a worthwhile investment that could expand the scope of possible missions for a solar sail. Further work must be done to develop the entire RCD architecture, and testing would need to be carried out on larger samples with a potential flight demonstration as well. The Reflective Control Device technology has already been successfully proven by ICAROS, and an implementation on a future NASA solar sail mission is probable given the state of the research and the maturity of the technology.
5. Sail Recovery Modeling
Among the range of off-nominal situations that NEA Scout may encounter, the most critical is that in which the solar sail flips around with the back of the sail facing directly towards the sun. There are several possible causes for this circumstance but the most likely source would be a failure of software resulting in a complete loss of the ACS. Even with the AMT in a trimmed position, the sail is not passively stable and experiences a small solar disturbance torque. Over a long enough time period, without any active control from the ACS, solar radiation pressure alone will eventually cause the sail to flip around with the back exposed to the sun. Although a complete turn-around is a severe situation, it does not necessarily have to result in a failed mission if the computer systems are able to reboot and an appropriate safe mode can be implemented. As shown in the diagram of NEA Scout in Fig. 1, the booms (support beams) for the sail are shaded from the sun by the solar sail itself. During the planning stages of NEA Scout, [5] this design choice was implemented when it was discovered that the booms would suffer severe thermal deformation if they were to be exposed to the sun. Even though the 7 meter-long booms are made of steel, they are extremely thin and can distort up to 1 m at the tips under direct sunlight in space. If the sail flips around and the backside faces towards the sun, there will be nothing to shield the booms from the thermal radiation and they will severely deform within an estimated time frame of 15–30 seconds. Exact predictions of the extent of boom deformation are nearly impossible to make because of the uncertain thermal stresses that the booms will be subject to and the difficulty in modeling thermal deformation. The best estimates provided by the Jet Propulsion Laboratory specify a nominal boom deformation of 0.6 m and a maximum deformation of 1.2 m [12]. Even in the nominal case, this deformation significantly affects the performance of the sail. As the sail curvature increases from the deformation, the diffuse reflection of sunlight by the sail increases and thus the solar torque increases. The present investigation was undertaken in order to determine how long it would take the sail to flip under different situations, what conditions the sail will experience if it does flip, what would be an appropriate safe mode for recovery of the sail, and how much would the flip and recovery cost in terms of fuel and overall impact to the mission.
The first step towards simulating a sail reversal was to create representations of the backside of the sail. In total, five different models were generating covering the range of possible booms deformations. The first model, labeled as the “undeformed” backside sail model, was intended to serve as a baseline with no deformation. This model, shown at the far left of Fig. 18, was made from the front side model of the sail but with the sail normals reversed in the tensor model. The other four models were simplified pyramids which attempted to account for the uncertain deformation. Four “deformed” backside sail models were needed because both the magnitude and the direction of the deformation of the booms is unknown [12]. Two of the deformed models have the booms deforming towards the sun, and the other two have the booms deforming away from the sun with one model in each pair having a magnitude of deformation of 0.6 m and the other having the maximum 1.2 m estimated magnitude of deformation. Two of these models are shown in the center and right of Fig 18.
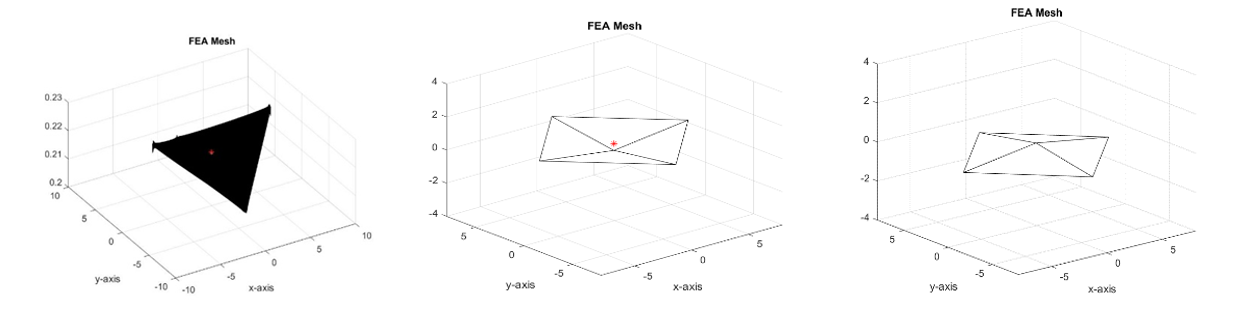 Figure 18.Backside Sail Models.
After the sail models had been completed, the next phase of the study was to develop a script that modeled a loss of attitude control of the sail. An existing script was modified to create a “free drift” simulation [13] in which the sail is allowed to freely rotate solely under the influence of solar radiation pressure. This script models a complete shutdown of computer systems which could have any number of causes for a spacecraft and actually occurred on LightSail 1 as a result of a file size overload [4][. (LightSail 1 systems recovered eight days later with a radiation-induced spontaneous computer reboot and the mission was able to continue successfully). The first round of trials using the free-drift script were used only to determine the behavior of the sail under no attitude control and did not include any attempts at recovery. Each model of the sail was tested starting at a SIA of 45˚ (a sail incidence angle greater than 90˚ indicates that the sail has reversed) with three different initial body rates. The results of the first phase of three runs for the non-deformed backside sail model are summarized in Table 5:
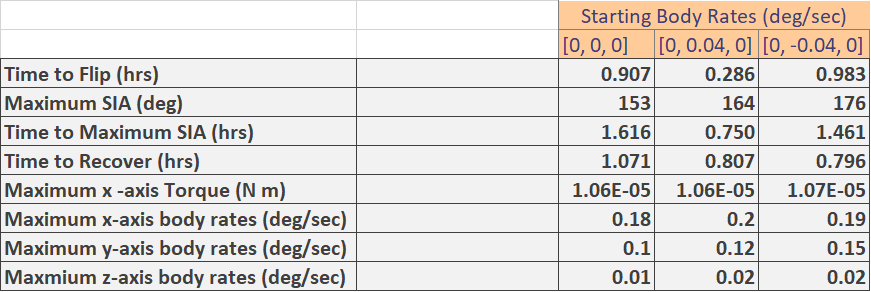 Table 5. Summary of Non-Deformed Backside Sail Model Free Drift.
The time for the sail to flip is heavily dependent on the initial starting body rate of the sail. The rate of 0.04 deg/sec on the y-axis was selected because that is the maximum body rate that is allowed during a communications slew of the spacecraft. This case modeled what would occur were the systems to shut down during a slew at the maximum rate which was considered to be the situation of most concern. Fig. 18 shows several parameters from the simulation of the non-deformed model run with an initial body rate of 0.04 deg/sec on the y axis.
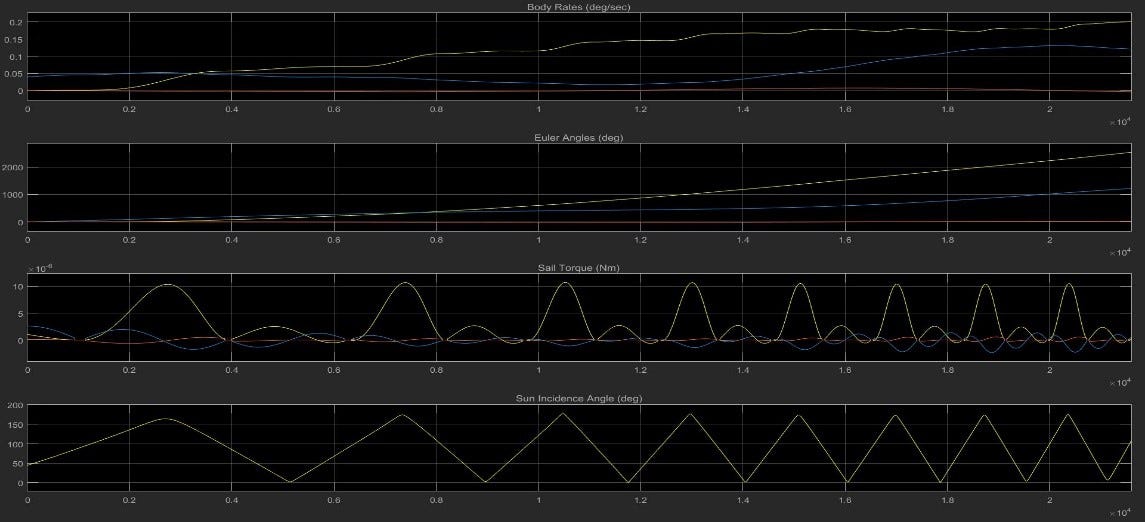 Figure 19. Summary of Non-Deformed Model Case with Initial Body Rates.
The bottom plot shows sun incidence angle (in degrees) versus time (in 104 seconds) and the moment when the sail reverses is identified as when the SIA goes over 90˚. Furthermore, an oscillatory motion of the sail can be observed in this plot. The sail clearly flips (SIA greater than 90˚) and then returns to the front side of the sail (SIA less than 90˚) repeatedly. This behavior mimics that observed on NanoSail-D2, when it was flown in 2011 [3]. NanoSail-D2 could not be controlled, and began to continuously rotate from back of the sail to the front reaching body rates on the order of tens of degrees/second. The behavior demonstrated in this case is much the same although not as severe. The top plot shows the body rate (in degrees/second) for all three axes versus time. The body rate on the y-axis builds over time, and after 6 hours, has reached an alarming 0.2 deg/sec. However, this is only after around 6 hours of a complete loss of control and it is estimated that if the computer systems were to completely shut down, they could be rebooted from the ground within 15 minutes. Therefore, it is not expected that the sail would have enough time to build up substantial body rates on any axis.
Based on the results from running the “free drift” script [13], four of the worst cases were selected to be run in a recovery script that attempted to model a recovery from the loss of attitude control. The primary objective of this phase of the study was to develop and test a safe mode that could be implemented by the G&C software with a minimal impact to the mission concept of operations. The safe mode was defined by the G&C team as using the RCS jets to point the spacecraft at the sun in as short a time frame as could be achieved. The reasoning behind this decision is that it would allow the spacecraft to regain knowledge of its attitude and charge the solar panels to ensure that all systems will be adequately powered. When the spacecraft initially reboots, it will have no information about its attitude and therefore will have to rely on the sun sensors to point at the sun under the power of the RCS thrusters. Two different recovery initiation criterion were defined. The first began recovery from the maximum SIA in order to mimic a worst case scenario while the second condition began recovery after a time period of 15 minutes to model the estimated reboot time for the computer systems. The main parameters to calculate for the study were the time for the spacecraft to reach a sun-pointing attitude, and the fuel used by the RCS to achieve this condition. Table 6 summarizes the results of the recovery simulations run with the 1.2 m deformed sail model which had demonstrated the most severe behavior in the initial phase of the research.
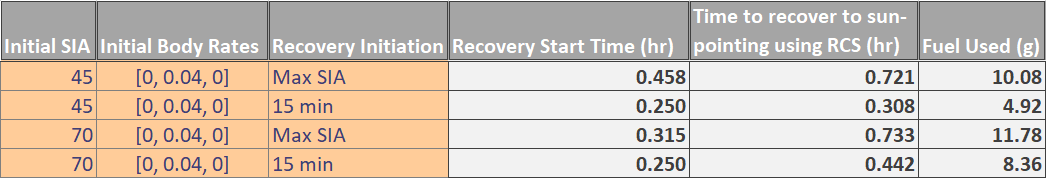 Table 6. Summary of Recovery Simulation Cases.
Even under the most extreme initial conditions and starting recovery from the maximum sun incidence angle, the time to recover was only 0.733 hours or 44 minutes and the fuel use was less than 12 grams. The conclusion from the second phase of the study was that the spacecraft would be able to successfully recover from a complete loss of computer systems. Moreover, the fuel and time penalty from recovery was not significant for a one-time event. This analysis further showed that a safe mode defined as sun-pointing using the RCS is practical and will be implemented into the G&C software. Another significant finding was that using IMU body rates to inform the G&C software during recovery was preferable to using star tracker rates. The star tracker is designated as the main provider of body rates and attitude knowledge during the parts of the mission where it is not expected that the body rates will be higher than 0.4 deg/sec. The IMU body rates are nominally supposed to be used only upon detumble when the star tracker will be rendered ineffective by the sun. However, in the recovery cases, using the IMU body rate information significantly reduced fuel usage because the overall body rate caused by the RCS maneuver is relatively high. At these higher rates, the IMU information can be more effectively filtered and was found to be the better choice to inform the software of the state of the spacecraft. More work on any recovery aspect of the mission should include developing a more accurate model of the backside of the sail that accounts for the boom deformation. Once that has been completed, the sail model can be tested in the free drift and recovery scripts to better characterize the behavior of the spacecraft upon flipping and the effects on the mission objectives due to this situation.
6. Sun Sensor Testing
The G&C software cannot correctly manage the ACS without a proper knowledge of the spacecraft’s state including position, orientation, and rates. The NEA Scout ACS contains several different sensors which are applicable in different stages of the mission. Three coarse sun sensors are to be used primarily on deployment from SLS in order to point the spacecraft at the sun and allow the solar panels to begin charging. The sun sensors are able to provide the information necessary for the ACS to calculate the sun vector in the body frame of the spacecraft which orients the spacecraft relative to the sun [14] The sun sensors can also be used for rough rate estimates by determining the change in spacecraft orientation over time. Furthermore, the sun sensors will be used at times when the star tracker is “blinded” or has a reduced field of view whether that be from the Earth, Moon, or Sun. Thus, the sun sensors are a crucial part of the mission and must be tested both for accuracy and to ensure that the data collected by the sensors is correctly interpreted by the G&C software. NEA Scout uses three sun sensors attached to three different-facing surfaces of the spacecraft to ensure that one sensor can sense the sun at all times. One individual sun sensor is shown in Fig. 20.
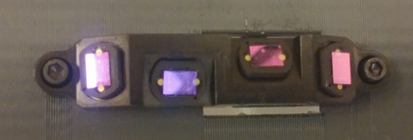 Figure 20. Sun Sensor for NEA Scout.
Each sun sensor is composed of four Silicon photodiodes that are designed to be most sensitive in the visible spectrum with wavelengths of light from 480 nm to 660 nm [14]. These four photodiodes produce an electrical signal with a strength proportional to the intensity of the light incident on the photodiode. From these four diode counts and the location of the sun sensor on the spacecraft, a sun-vector in the body frame of the spacecraft will be calculated by the G&C software. The initial task was to determine if the sun sensor could be correctly figured. The sun sensors for NEA Scout are provided by Blue Canyon Technologies (BCT) and the particular sun sensor available for testing [15] was an engineering development unit (EDU) that included the necessary communications interface to allow the sun sensor inputs to be sent to a personal computer. Configuration tests were done in the robust product demonstration test-bed in building 4600 at MSFC. The sun sensor was attached flat to a mounting bracket and subjected to electromagnetic radiation from a high intensity incandescent lamp. Several orientations of the sun sensor were tested. After each test, the resulting raw data was fed into a G&C processing script which calculates the sun vector of the spacecraft. The vectors that were output could be manually checked because the angle of the sun sensor relative to the lamp (effectively the sun incidence angle) was known and the sun sensor was modeled as being on the +z face of the spacecraft. For a sun incidence angle of 0˚, the resulting unit sun vector should be [0, 0, 1] which was found to be the result. An additional task for initial testing was taking the sun sensor outside and verifying that the photodiodes were generating the correct outputs when exposed to the sun at 1 AU. From the BCT technical information, [15] the photodiodes have a minimum electrical count threshold they should register when exposed to the sun at 1 AU. After taking into account the 30% attenuation of the sun’s intensity by the Earth’s atmosphere and the seasonal decrease in solar intensity due to the 23.5˚ obliquity of the Earth, the photodiode counts were in the specified range. These initial configuration tests demonstrated that the engineering development unit was performing as expected and that the G&C software could convert the raw data from the sun sensors into usable information.
The next step was to perform a series of tests with the sun sensor attached to a rotating telescope that could provide truth data in order to determine the accuracy of the sensor. Unfortunately, time constraints did not allow for this round of testing to be completed before the drafting of this report. However, the associated equipment for the testing was manufactured and the test description that follows will executed before the full avionics testbed. Testing is to be carried out at the Automated Lunar and Meteor Observatory (ALaMO) located on the Redstone Arsenal. This facility has a 14 inch telescope atop a 15 meter tall tower with a roll-off roof. This telescope is ideal as it features automated sun tracking and can be operated across the range of testing rates and right ascension and declination angles. Five different tests were developed to test the accuracy and capabilities of the sun sensor as summarized in Table 7.
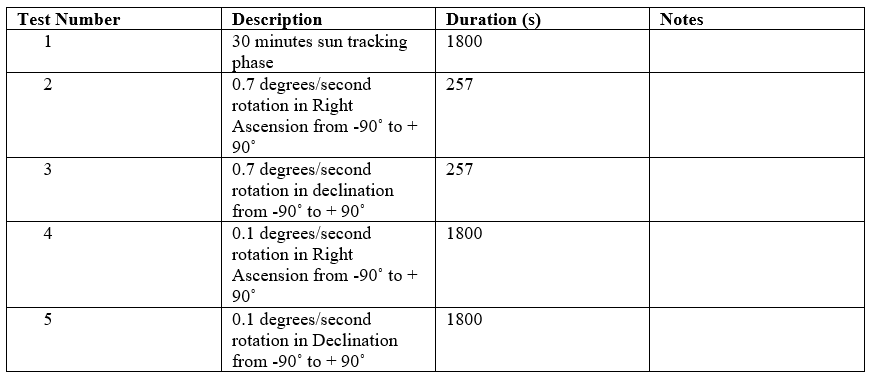 Table 7. Test Matrix for BCT Sun Sensor.
For each case, the raw diode measurements will be collected as well as the inertial right ascension and declination angles from the telescope that will serve as truth data. All measurements are to be taken at 5 samples/second and the sun sensor information is read and written to .csv files by a Python script specifically developed for the tests. With set-up time and potential delays between trials, the entire procedure duration is estimated to be four hours and will require a clear sky for the duration of the experiment.
The Blue Canyon Sun Sensor Engineering Development Unit [16] electronics set is shown in Fig. 21:
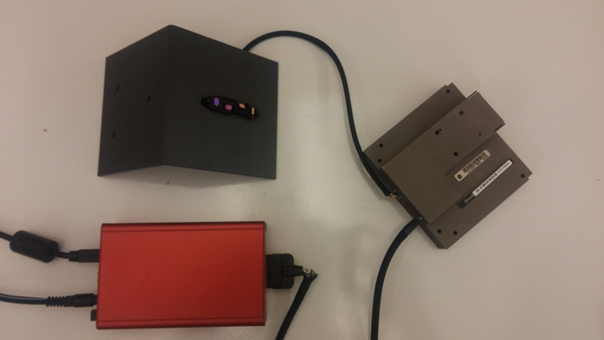 Figure 21. BCT Sun Sensor EDU.
The sun sensor itself is mounted on a 3-D printed plate specifically designed for this test and modeled using Computer Aided Design. The grey box on the right of Fig. 21 is the XACT attitude control system box. It interfaces with the red box designated the XTC communications tool that is used to communicate between the sensor and a computer [16]. The red box is connected to a power supply and via a USB cable to a computer. The information from the sun sensor is sent to the XACT ACS using the RS-422 communication protocol. The XTC adapts this signal into a USB signal that can be used to record and save data for later analysis. The results from the initial sun sensor testing demonstrate that the sun sensor is correctly configured for the NEA Scout mission, and that the G&C software can correctly read and interpret the inputs to generate the sun vector used to orient the spacecraft. Although the final phase of sun sensor testing has yet to be completed, it will provide an accuracy check for the sun sensor and is scheduled to be completed before the full avionics testbed. Based on this study, the G&C software will be able to rely on the information provided by the sun sensor in order to issue commands to the Attitude Control System.
III. Conclusions
Validation and Verification of any complex system is composed of many subtasks rather than one main assignment. Each individual survey has its own takeaways and implementations that combine together to result in a robust spacecraft that is prepared to meet all mission objectives. The conclusions from each investigation detailed in this report are summarized as follows:
1. The RCS has a quantified level of manufacturing variability in both the angle and magnitude of the thrust from each jet. The variation is of concern for the initial detumble of NEA Scout upon deployment from SLS when body rates could be as high as 10 deg/sec on each axis. A number of cases were run to simulate the detumble maneuver with different combinations of deviations in the magnitude and direction of the thrust. In the worst documented case, the fuel usage of the RCS was four times greater than the nominal case. However, considering the total amount of fuel used, any excess fuel consumption during detumble resulting from manufacturing variations would not severely impact the mission. Time to detumble was not significantly altered by the thrust variation in the RCS.
2. A decrease in the specular reflectivity coefficient caused by meso-scale sail wrinkling will result in a larger solar torque on the spacecraft. Modeling of the decreased specular reflection in the full spacecraft model showed that the increased solar torque will not significantly impact the mission across the range of expected operating solar incidence angles because the solar torques can be adequately managed by the AMT and RCS. Even the lowest possible specular reflection value would not result in a failure to complete the mission objectives. However, more research needs to be done to characterize the optical properties of the entire sail.
3. Passive roll control by means of oscillation about a stable equilibrium angle is possible for NEA Scout. Above a 20˚ sun incidence angle, there are specific clock angles around which the spacecraft oscillates rather than continuing to roll and build up z-axis (roll) momentum. If a stable clock angle is attained, the RCS will not be required to activate to desaturate the roll momentum of the RW. By utilizing passive roll control, the sail can be stabilized in roll without the need for the RCS to desaturate the reaction wheels. Moreover, if the spacecraft is initially at an unstable clock angle, it can be placed into a stable attitude with a relatively minor firing of the RCS jets. Overall, this option would reduce fuel usage when compared to the current concept of operations which specifies frequent firings of the RCS to desaturate the RW roll momentum.
4. Reflective control devices (RCD) are a feasible option for controlling the sail without fuel consumption. These RCDs would be composed of polymer dispersed liquid crystal (PDLC) films with changeable optical properties. By positioning one RCD pair on each boom, an in-plane (x-axis and y-axis) control torque can be generated to counteract the solar torque. Furthermore, by tilting the RCDs at an angle to the sail, a roll control torque can be generated allowing for all control of the torque on all three axes of the spacecraft. The total weight and power cost of the RCDs for a sail the size of NEA Scout is well within practical consideration.
5. In the event of a complete loss of computer systems, the sail will reverse with the back side facing towards the sun because the spacecraft is not statically stable. This will result in severe deformation of the booms and will set the sail oscillating from the back and the front at a body rate up to 0.2 deg/sec. In order to recover from this situation, a safe mode was defined as using the RCS to point the spacecraft at the sun relying on the IMU body rates to inform the G&C software. The fuel consumption and time to implement this maneuver should not affect the mission for a single occurrence.
6. The Blue Canyon Technology sun sensors supplied to the NEA Scout mission need to be tested for accuracy and compatibility with the software. Initial testing has shown the sensors are correctly configured and the data inputs can be interpreted by the control software. Further testing to characterize the accuracy of the sun sensors has been defined.
Although these investigations covered a wide range concerns, they are but a small subset of the tasks that comprise the validation and verification of a system as complex as a spacecraft. The results of the documented studies have proved that the G&C software which manages the ACS is robust and can successfully carry out all mission objectives. The development of the NEA Scout software is nearing completion and these results have provided the team with confidence that the control model will be able to execute its responsibilities. The ground assessment and examination phase while shortly be finished and the ultimate test of the engineering will come with the launch of Near Earth Asteroid Scout on SLS Exploration Mission One.
IV. Acknowledgements
The author would like to thank the entire Near Earth Asteroid Scout Guidance and Control team in EV-42 at NASA Marshall Space Flight Center for their guidance and instruction throughout the duration of the work documented. In addition, the author would like to thank all the engineers, scientists, technicians, and laborers upon which this work, as in all engineering work, builds. This report would not be possible without the foundations of space exploration laid down by countless engineers over the decades that have put humans on the brink of becoming a multiplanetary species.
V. References
[1] McInnes, C., Solar Sailing: Technology, Dynamics, and Mission Applications, Chichester, UK: Springer-Praxis, 1999.
[2] Tsuda, Y., Mori, O., Funase, R., Sawada, H., Yamamoto, T., Saiki, T., Endo, T., Yonekura, K., Hoshino, H., and Kawaguchi, J., “Achievement of IKAROS — Japanese deep space solar sail demonstration mission”, Acta Astronautica, Vol. 82, №2, 2013, pp. 183–188.
[3] Johnson, L., Whorton, M., Heaton, A., Pinson, R., Laue, G., and Adams, C., “NanoSail-D: A solar sail demonstration mission”, Acta Astronautica, Vol. 68, №5–6, 2011, pp. 571–575.
[4] Betts, B., Nye, B., Vaughn, J., Greeson, E., Chute, R., Spencer, D., Ridenoure, R., Munakata, R., Wong, S., Diaz, A., Stetson, D., Foley, J., Bellardo, J., and Plante, B., LightSail 1 Mission Results and Public Outreach Strategies, Pasadena, California: Planetary Society, 2016.
[5] McNutt, L., Johnson, L., Clardy, D., Castillo-Rogez, J., Frick, A., and Jones, L., Near-Earth Asteroid Scout, Huntsville, AL: NASA Marshall Space Flight Center, 2014.
[6] Orphee, J., Diedrich, B., Stiltner, B., Becker, C., and Heaton, A., “Solar Sail Attitude Control System for the NASA Near Earth Asteroid Scout Mission”, International Symposium on Solar Sailing, Huntsville, AL: NASA Marshall Space Flight Center, 2017.
[7] Department of Defense Documentation of Verification, Validation, and Accreditation (VV&A) for Models and Simulations.” United States Department of Defense, DOD Instruction 5000.61, December 9, 2009.
[8] Heaton, A, Ahmad, N., and Miller, K., “Near Earth Asteroid Scout Thrust and Torque Model”, International Symposium on Solar Sailing, Huntsville, AL: NASA Marshall Space Flight Center, 2017.
[9] Wright, J., Space sailing, Yverdon [u.a.]: Gordon and Breach, 1993.
[10] Ma, D., Murray, J., and Munday, J., “Controllable Propulsion by Light: Steering a Solar Sail via Tunable Radiation Pressure”, Advanced Optical Materials, Vol. 5, №4, 2016
[11] Wang, U., “Making Smart Windows that Are Also Cheap”, MIT Technology Review Available: https://www.technologyreview.com/s/420221/making-smart-windows-that-are-also-cheap/.
[12] Carlisle, G., Stuart, J., and Lantoine, G., “NEA Scout Peer Review”, 2016.
[13] Orphee, J., and Stiltner, B., “Near Earth Asteroid AMT-RCS Calibration”, 2017.
[14] Bullock, D., Edberg, D., Heaton, A., Stiltner, B., Becker, C., Diedrich, B., and Orphee, J., Performance Characterization of Sun Sensor and Inertial Measuring Unit for the Near Earth Asteroid Scout Mission, Huntsville, AL: NASA Marshall Space Flight Center, 2017.
[15] Blue Canyon Technologies, BCT Sun Sensor Technical Drawing Rev. C, Doc. Num: 3ICD1065 Boulder, Colorado: 2016.
[16] Blue Canyon Technologies, XACT GUI User Guide Revision B, Drawing Number: 3PR0750, Boulder, Colorado: Blue Canyon Technologies, 2014.