
Biases and How to Overcome Them

We’re awful at viewing the world objectively. Data can help.
There’s a pervasive myth — perhaps taught to you by an economics course — that humans are rational. The traditional view is we objectively analyze the world, draw accurate conclusions, and make decisions in our best interest. While few people completely buy into this argument anymore, we are still often unaware of our cognitive biases, with the result that we vote, spend money, and form opinions based on a distorted view of the world.
A recent personal experience where I badly misjudged reality — due to cognitive illusions— brought home this point and demonstrated the importance of fact-checking our views of the world. While this situation had no negative consequences, it was a great reminder that we are all subject to powerful biases and personal opinions are no substitute for checking the data.
Shortly after moving to Boston, I thought I noticed a striking phenomenon: loads of people smoking. After a few days, it seemed to me that every street corner was filled with people lighting up cigarettes. Having come from a small midwestern town where it was exceedingly rare to see anyone smoking, I was dismayed: maybe the big city encouraged negative vices I would eventually pick up, or worse, smoking rates were on the rise nationwide.
While a few decades ago I would have had no option but to either persist in this belief or painstakingly look for demographic data in a library, now I was able to find verified data from the Centers for Disease Control and Prevention within seconds. To my surprise, and dealing a large blow to my rational view of myself, I found the following table comparing smoking rates in the metro area nearest my small town (Peoria, IL) to those in Boston:
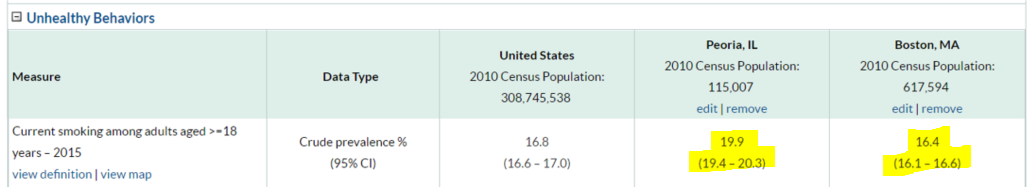 Source: CDC
Not only was I wrong, I was significantly wrong as indicated by the non-overlapping 95% confidence intervals. (Although we tend to focus on a single number, considering uncertainty estimates is crucial especially when dealing with real-world demographic data). To show visually how wrong I was, even accounting for the uncertainty, I made the following smoking rate boxplots:
 Boxplot of Smoking Rates
Why was I so wrong? I’m a firm believer in analyzing your mistakes so you don’t make them again and, in this process, I came up with three reasons:
- Availability heuristic: we judge how likely something is by the number of occurrences of it we can bring to memory.
- Confirmation bias: once we have a belief, we unconsciously seek out evidence that confirms it and ignore evidence that contradicts it.
- Denominator neglect: we look at only the numerator — the number of smokers — and ignore the denominator — the total people we see over the course of a day.
These are all examples of cognitive biases — mistakes in reasoning and deviations from rational decision making — or heuristics — mental shortcuts (rules of thumb) we use to quickly make judgements. While these served us well in our evolutionary past, they often fail us in today’s world. We are now required to process many streams of information with complex interacting factors and our fast intuitions are not adapted for this purpose.
(For the definitive reference on cognitive biases and how to overcome them, read Daniel Kahnemann’s masterwork Thinking, Fast and Slow. A less intimidating format for learning these is the You Are Not So Smart Podcast).
One of the simplest ways to correct for our innate shortcomings is to fact-check ourselves. Especially in an age with so much accurate information freely available there is no excuse for persisting in false beliefs. Instead of reasoning from personal experience/anecdotes, look up the actual numbers!
Moreover, in addition to just figuring out the right answer, it’s important to think about why we erred. We’re never going to rid ourselves of cognitive biases, but we can learn to recognize when they occur and how to overcome them. For example, I should have noticed the people who weren’t smoking (the denominator), or thought about the total number of people I see in my small town every day compared to the number of people I observed in Boston.
Building on that last point, while looking at data by itself is useful, trying to understand what it means in the context of your life can be more helpful. This is where some statistics and basic data manipulation can go a long way.
On an average day in my home town, I probably saw about 50 people walking around (okay no one walks in the Midwest but stay with me) compared to Boston with maybe 100 times as many at 5,000. Knowing the smoking rate and the total number of people I expect to see, I simulated 10,000 days to find out how many smokers I would expect to see on a day in Boston versus my hometown. (Jupyter Notebook available on GitHub).
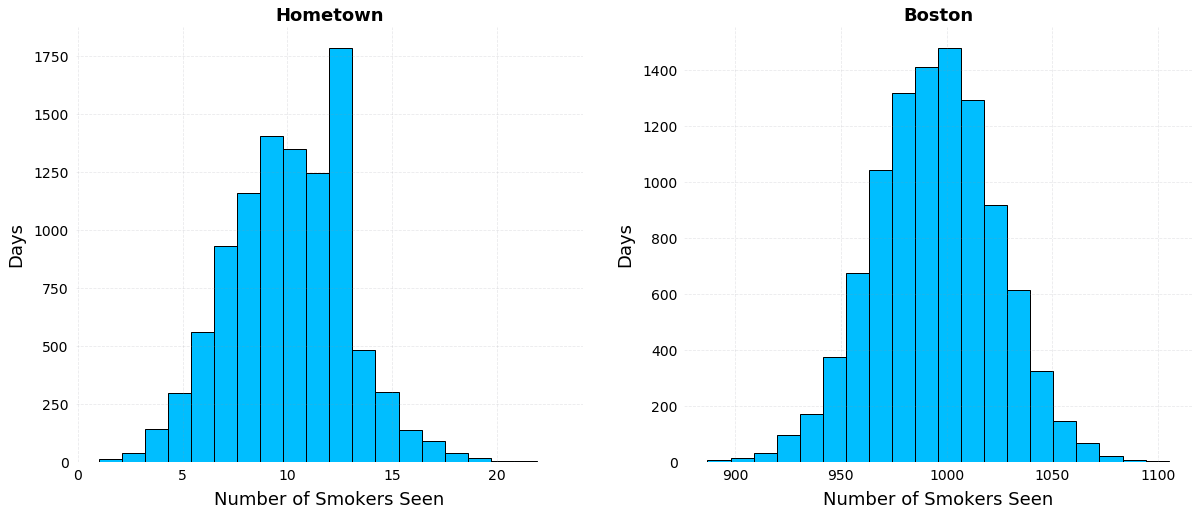 Simulation results for 10,000 days in my hometown versus Boston.
Even though my hometown has a statistically greater proportion of smokers, in terms of raw numbers, on an average day, I’d see about 100 times the number of smokers in Boston. These graphs, coupled with my neglect of the denominator, show why I was so susceptible to the availability heuristic.
Why This Matters
While this small example is innocuous, the general impact of our biases is pervasive and often detrimental. For instance, because of a predominantly negative news cycle (manifesting in the availability heuristic), people generally think the world is getting worse. If fact, by almost all objective measures, we are living at the best time in human history and things are improving. (All graphs from Enlightenment Now by Steven Pinker).

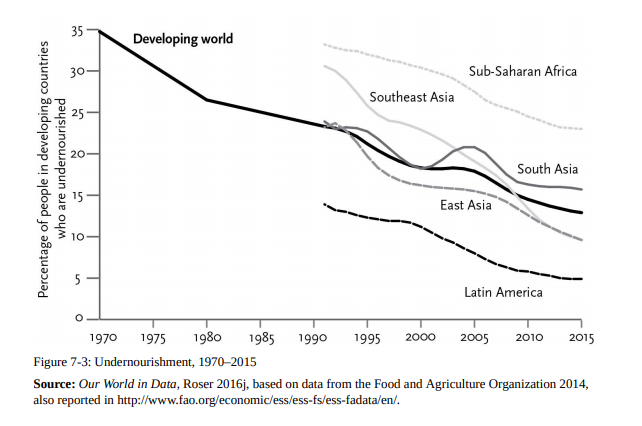

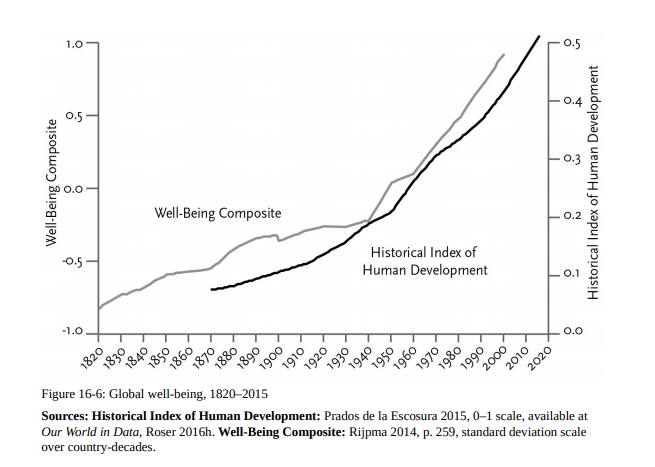 Graphs showing positive gains in numerous measures worldwide.
This has real-world implications: people vote for leaders who promise a return to better times because they haven’t looked at the data and realized the best time is now! Moving away from politics, think about your personal life: is there a relationship you’ve spent too long in, a negative job you’ve stuck with, or even a book you continue reading despite not enjoying? Then you’ve fallen victim to the Sunk-Cost Fallacy, where we continue squandering time on an endeavor because of the effort we’ve already put in.
As another example, if you find yourself worrying about air travel, instead of reading about the miniscule number of plane crashes, look at the data showing flying is the safest way to travel.
I’ve tried to adopt two simple rules for myself to mitigate cognitive biases:
- Look up relevant data: try to find multiple reputable sources, consider uncertainty estimates, and explore the data yourself when available
- Seek out disconfirming evidence: when everything you read confirms your beliefs, it’s probably time to read something else.
Following these guidelines won’t make me perfect, but they are helping me gradually become less wrong. I don’t believe there’s always one objective truth, but I do think facts are much better than our subjective judgements.
To end this article on a happy note, here’s a graph showing the decline in smoking rates in the United States (despite my misbelief)!
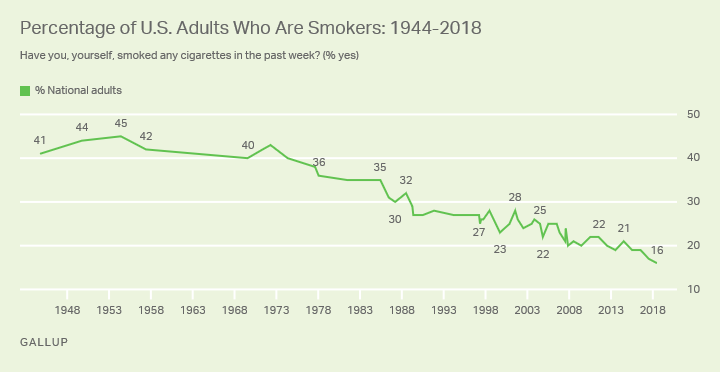 National Smoking Rates in the United States (Source: Gallup). There’s no substitute for accurate data.
As always, I welcome feedback and constructive criticism. I can be reached on Twitter @koehrsen_will or through my website at willk.online.