
How to Visualize a Decision Tree from a Random Forest in Python Using Scikit-Learn

A helpful utility for understanding your model
Here’s the complete code: just copy and paste into a Jupyter Notebook or Python script, replace with your data and run:
The final result is a complete decision tree as an image.
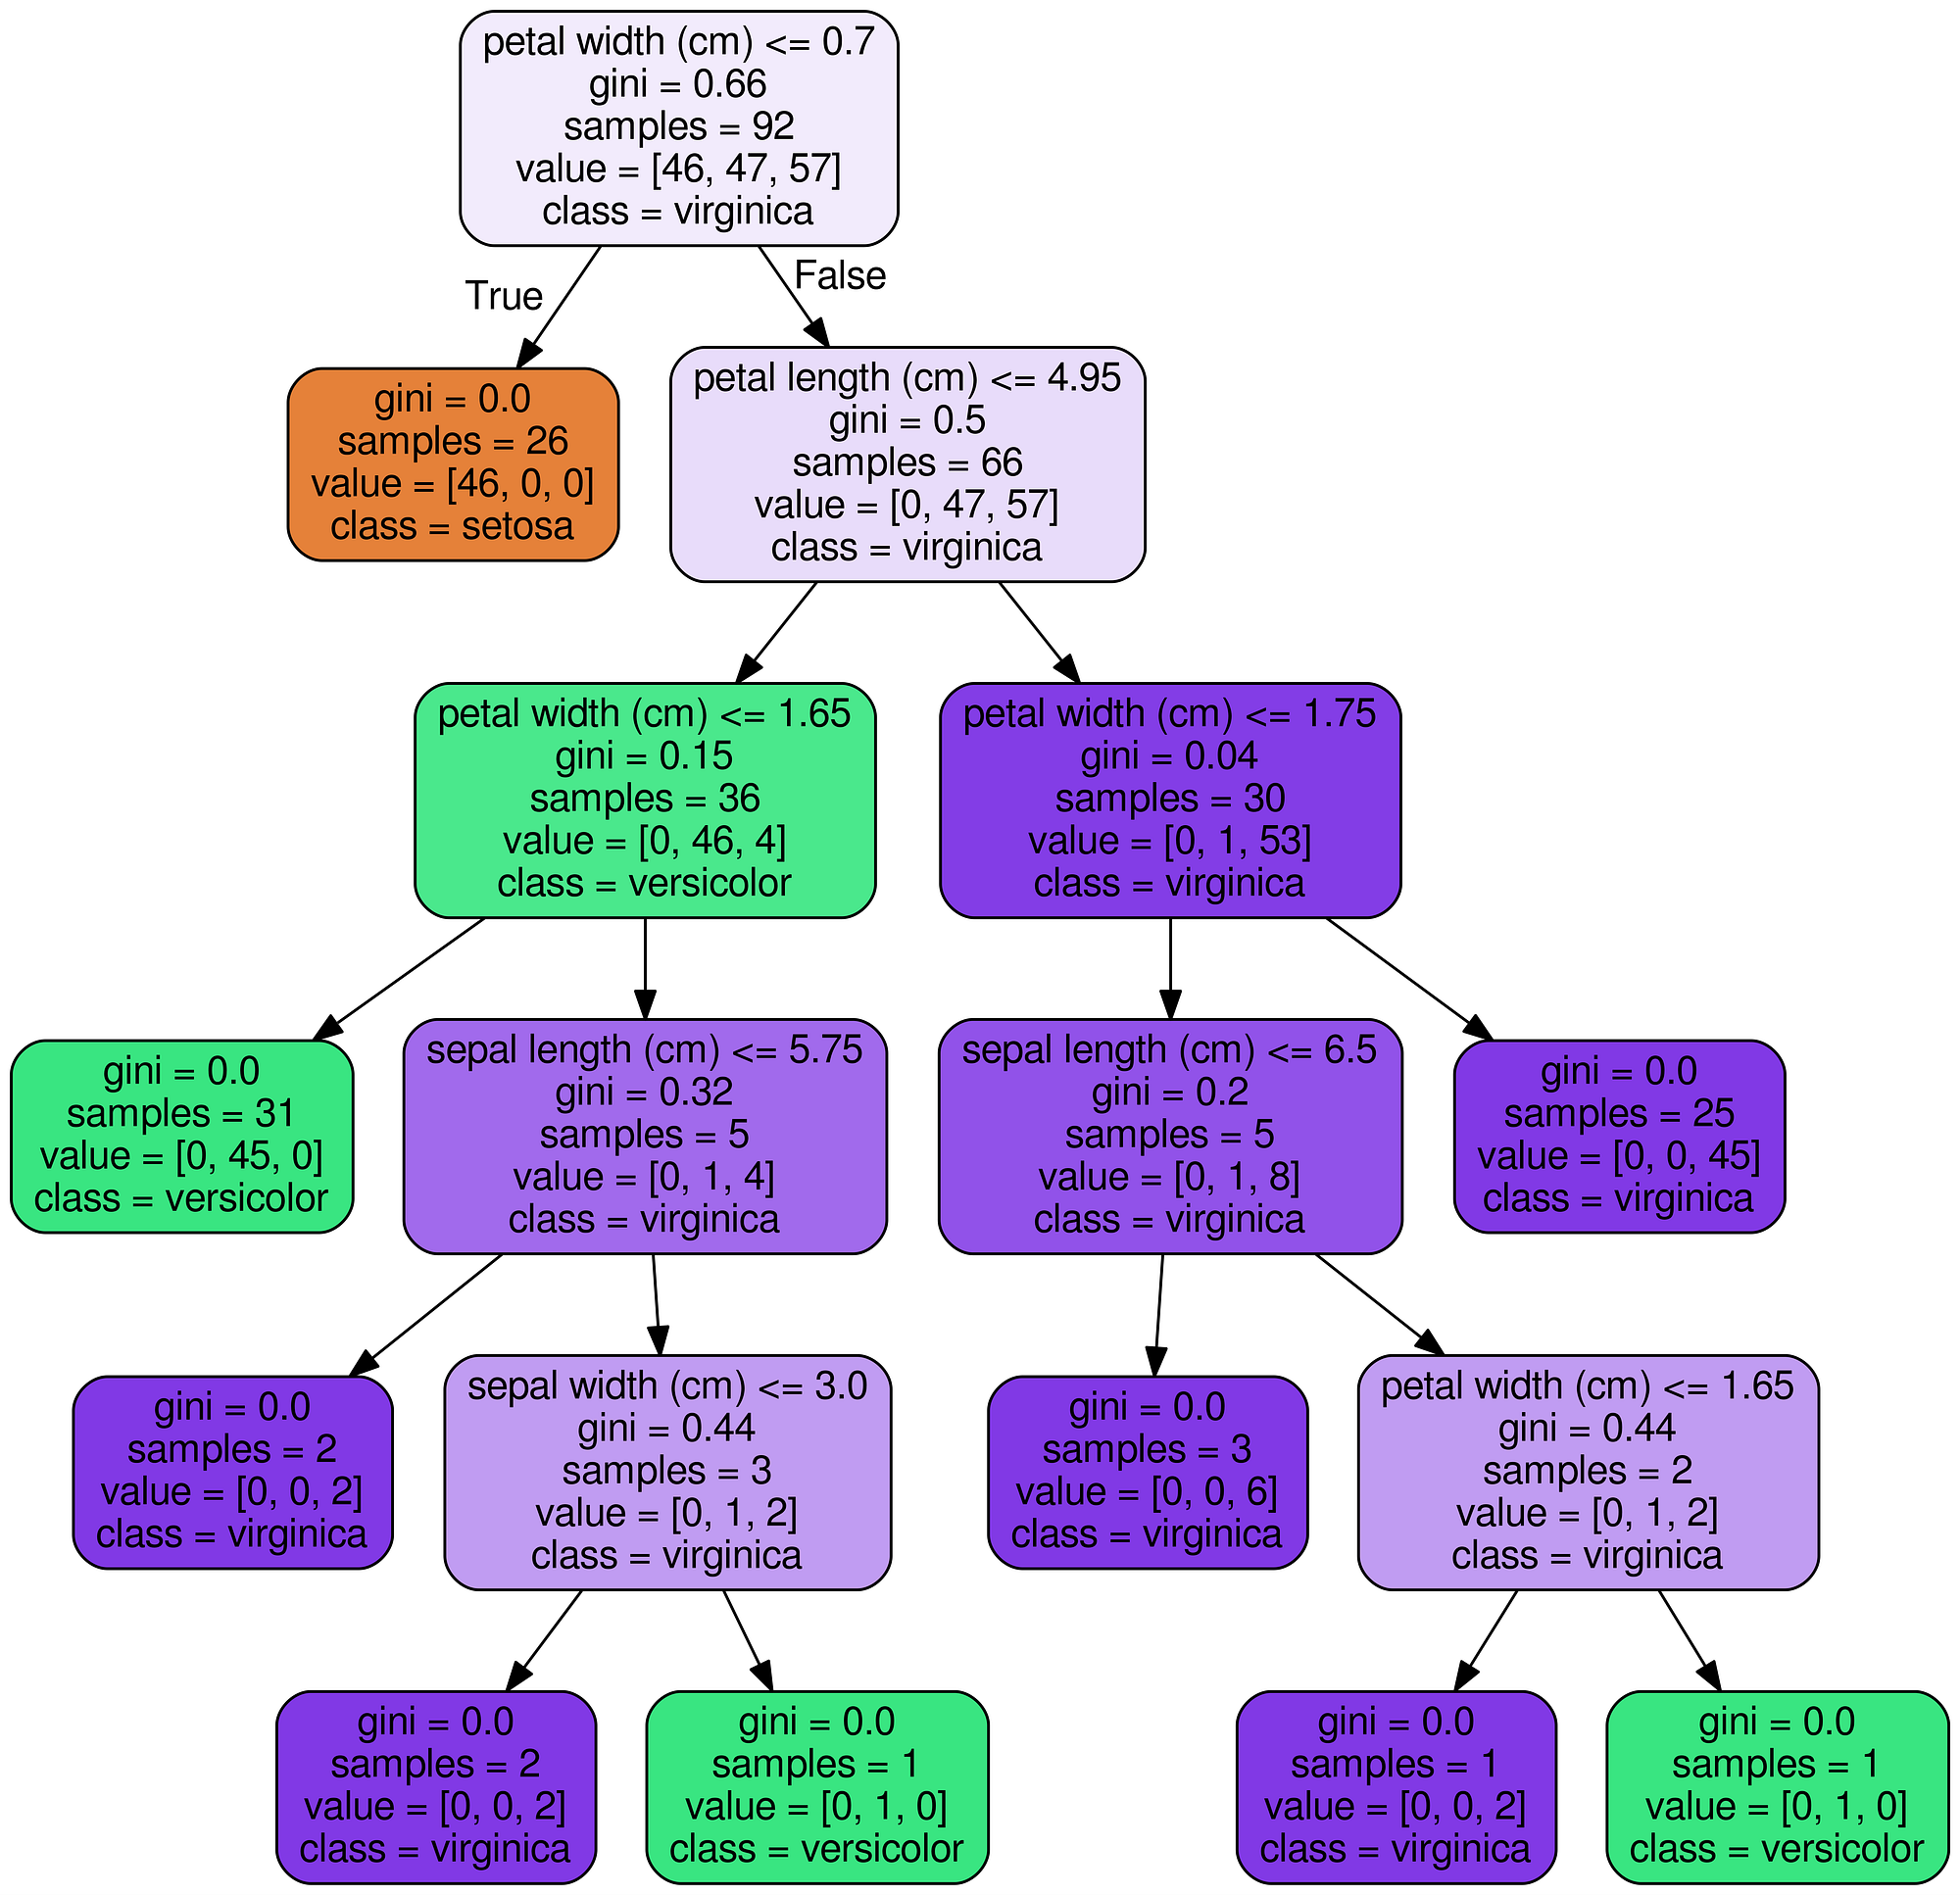 Decision Tree for Iris Dataset
Explanation of code
-
Create a model train and extract: we could use a single decision tree, but since I often employ the random forest for modeling it’s used in this example. (The trees will be slightly different from one another!).
from sklearn.ensemble import RandomForestClassifier model = RandomForestClassifier(n_estimators=10) # Train model.fit(iris.data, iris.target) # Extract single tree estimator = model.estimators_[5] -
Export Tree as .dot File: This makes use of the
export_graphvizfunction in Scikit-Learn. There are many parameters here that control the look and information displayed. Take a look at the documentation for specifics.from sklearn.tree import export_graphviz # Export as dot file export_graphviz(estimator_limited, out_file='tree.dot', feature_names = iris.feature_names, class_names = iris.target_names, rounded = True, proportion = False, precision = 2, filled = True) -
Convert
**dot**to**png**using a system command: running system commands in Python can be handy for carrying out simple tasks. This requires installation of graphviz which includes the dot utility. For the complete options for conversion, take a look at the documentation.# Convert to png from subprocess import call call(['dot', '-Tpng', 'tree.dot', '-o', 'tree.png', '-Gdpi=400']) -
Visualize: the best visualizations appear in the Jupyter Notebook. (Equivalently you can use
matplotlibto show images).# Display in jupyter notebook from IPython.display import Image Image(filename = 'tree.png')
Considerations
With a random forest, every tree will be built differently. I use these images to display the reasoning behind a decision tree (and subsequently a random forest) rather than for specific details.
It’s helpful to limit maximum depth in your trees when you have a lot of features. Otherwise, you end up with massive trees, which look impressive, but cannot be interpreted at all! Here’s a full example with 50 features.
 Full decision tree from a real problem (see here).
Conclusions
Machine learning still suffers from a black box problem, and one image is not going to solve the issue! Nonetheless, looking at an individual decision tree shows us this model (and a random forest) is not an unexplainable method, but a sequence of logical questions and answers — much as we would form when making predictions. Feel free to use and adapt this code for your data.
As always, I welcome feedback, constructive criticism, and hearing about your data science projects. I can be reached on Twitter @koehrsen_will