How To Generate Prediction Intervals With Scikit Learn And Python

(Source)

Using the Gradient Boosting Regressor to show uncertainty in machine learning estimates

“All models are wrong but some are useful” — George Box. It’s critical to keep this sage advice in mind when we present machine learning predictions. With all machine learning pipelines, there are limitations: features which affect the target that are not in the data (latent variables), or assumptions made by the model which don’t align with reality. These are overlooked when we show a single exact number for a prediction — the house will be $450,300.01 —which gives the impression we are entirely confident our model is a source of truth.

A more honest way to show predictions from a model is as a range of estimates: there might be a most likely value, but there is also a wide interval where the real value could be. This isn’t a topic typically addressed in data science courses, but it’s crucial that we show uncertainty in predictions and don’t oversell the capabilities of machine learning. While people crave certainty, I think it’s better to show a wide prediction interval that does contain the true value than an exact estimate which is far from reality.

In this article, we’ll walk through one method of producing uncertainty intervals in Scikit-Learn. The full code is available on GitHub with an interactive version of the Jupyter Notebook on nbviewer. We’ll focus primarily on implementation, with a brief section and resources for understanding the theory at the end. Generating prediction intervals is another tool in the data science toolbox, one critical for earning the trust of non-data-scientists.

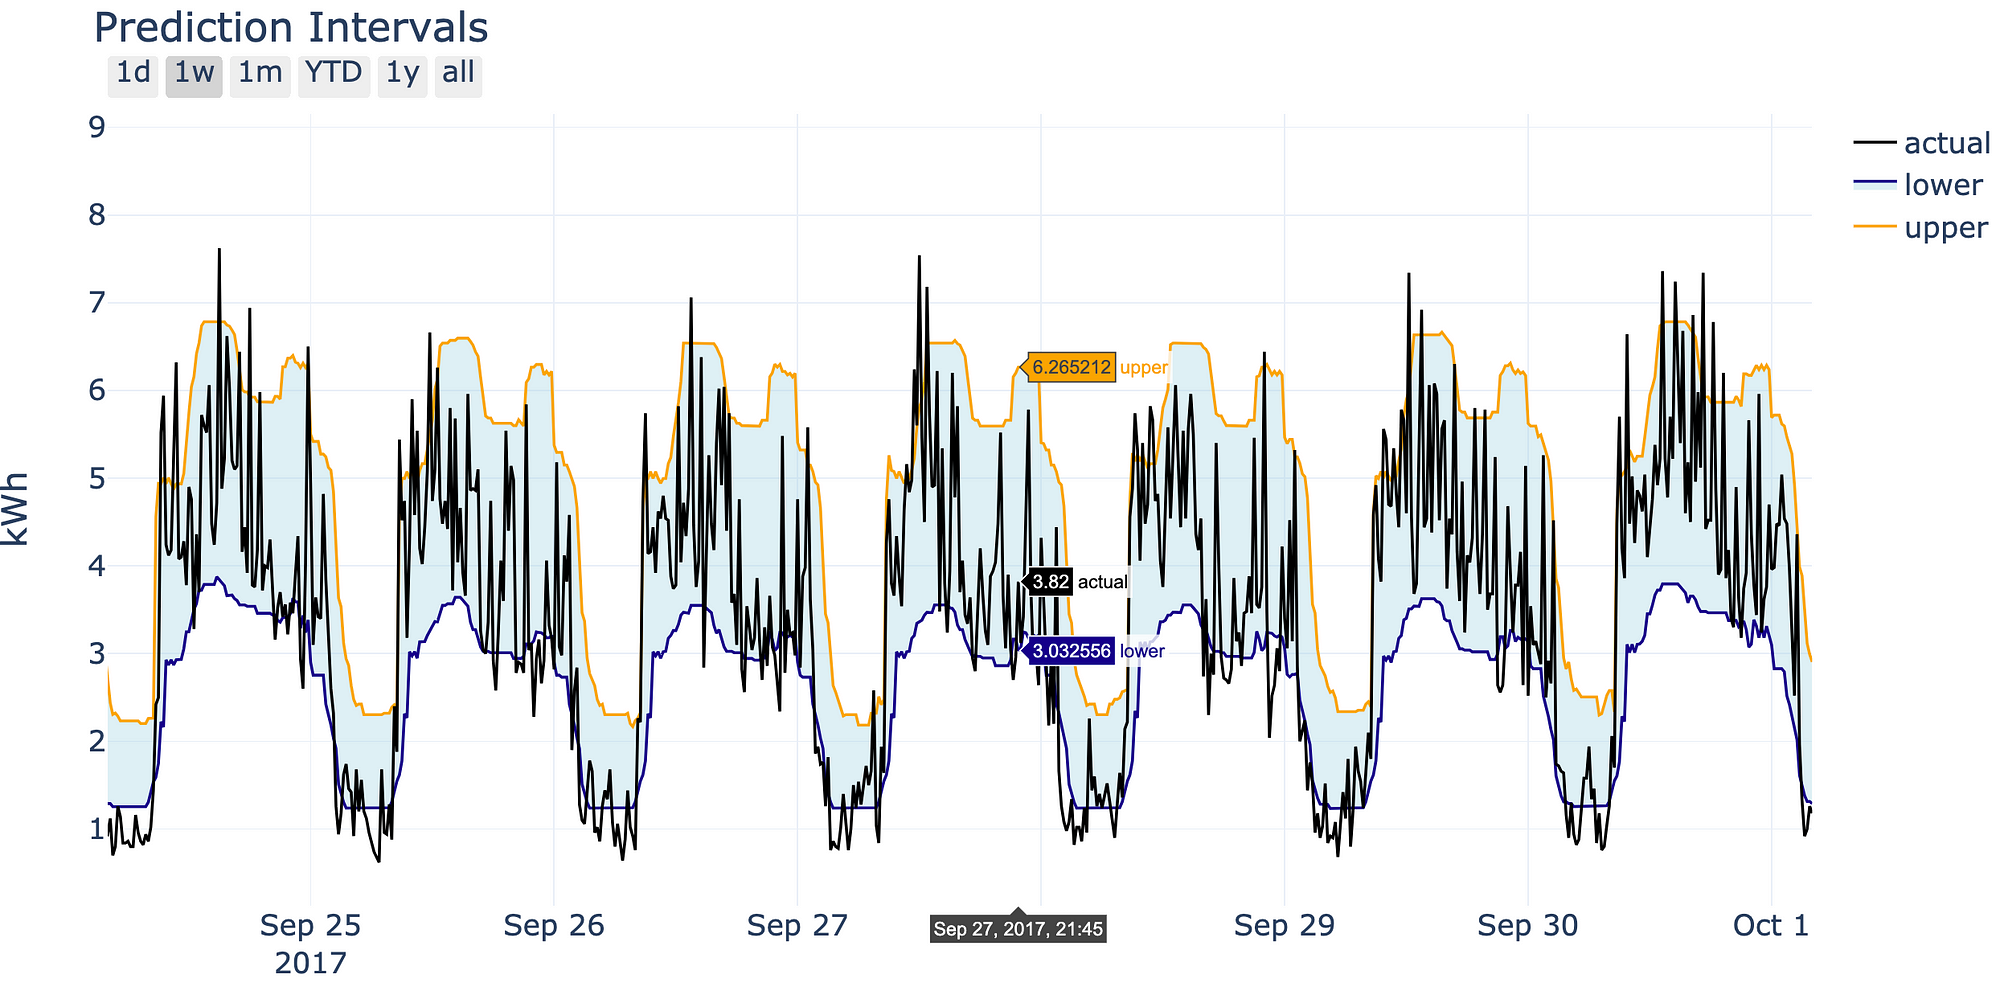
Prediction intervals we’ll make in this walkthough.

Read More

Is The Job Of Data Scientist At Risk Of Being Automated

Source

A useful test for determining if your job can be done by a machine with an application to data scientist

Amara’s Law states we tend to overestimate the effect of a technology in the short term but underestimate the effect in the long term. We see this play out repeatedly with technologies ranging from trains to the internet to now machine learning. The trend is nearly always the same: initial, wildly optimistic claims about the capabilities of an innovation are followed by a period of disillusionment when it fails to deliver before finally, we figure out how to use the technology and it goes on to fundamentally reshape our entire world (this is known as the hype cycle).

The basic idea of Amara’s Law — smaller short-term effects than claimed but much larger long-term effects than was imagined — can also be seen repeatedly in the overall effect of technology on the job humans do. The first steel plow, invented in the 1830s, did not immediately displace all farmers, but over the period from 1850 to modern times, the percentage of people working agriculture jobs in the US went from >50% to <2%. (Through a combination of innovations, not just mechanical technology, a far smaller percentage of people now produce a vastly larger amount of food.)

Likewise, US manufacturing jobs went from 40% of the total jobs to less than 10%, not in one or two years, but over decades (through a combination of automation and outsourcing). Again we see minor ripples over the course of a few years, but a fundamental restructuring of the economy over a long enough time period. Moreover, it’s critical to point out that people always find other jobs. Today, we have the lowest unemployment levels in 50 years, because when some jobs are automated, humans simply switch to new jobs. We constantly invent new careers to meet our needs, including the entire service economy (which employs the majority of Americans since the decline of agriculture and manufacturing), or, on a personal level, the role of data scientist, which became widely recognized only in 2012.

Read More

100 Miles Through The Park What Its Like To Run A 100 Mile Ultramarathon

Source

The Why and How of Running an Ultramarathon: A Personal Account of the 2019 Potawatomi Trail Runs

Why? Before you can even talk about running a 100-mile ultramarathon, you have to answer the inevitable question: why put yourself through months of training, make numerous sacrifices, and endure extreme suffering, all to spend 24+ hours running around a park in the middle of nowhere? Throughout history people have given good reasons for doing difficult things: Mallory’s “because it’s there” and Kennedy’s “because it’s harrrrrrrd” come to mind. For myself, I’ve found ultra-athlete David Goggins’ reasoning to be more on point. Put simply, I am terrified of living a life so unchallenging that I never figure out what I’m capable of.

Read More

Set Your Jupyter Notebook Up Right With This Extension

(Source)

A handy Jupyter Notebook extension to help you create more effective notebooks

In the great talk “I Don’t Like Notebooks” (video and slides), Joel Grus lays out numerous criticisms of Jupyter Notebooks, perhaps the most popular environment for doing data science. I found the talk instructive — when everyone thinks something is great, you need people who are willing to criticize it so we don’t become complacent. However, I think the problem isn’t the notebook itself, but how it’s used: like any other tool, the Jupyter Notebook can be (and is) frequently abused.

Thus, I would like to amend Grus’ title and state “I Don’t Like Messy, Untitled, Out-of-Order Notebooks With No Explanations or Comments.” The Jupyter Notebook was designed for literate programming — mixing code, text, results, figures, and explanations together into one seamless document. From what I’ve seen, this notion is often completely ignored resulting in awful notebooks flooding repositories on GitHub:

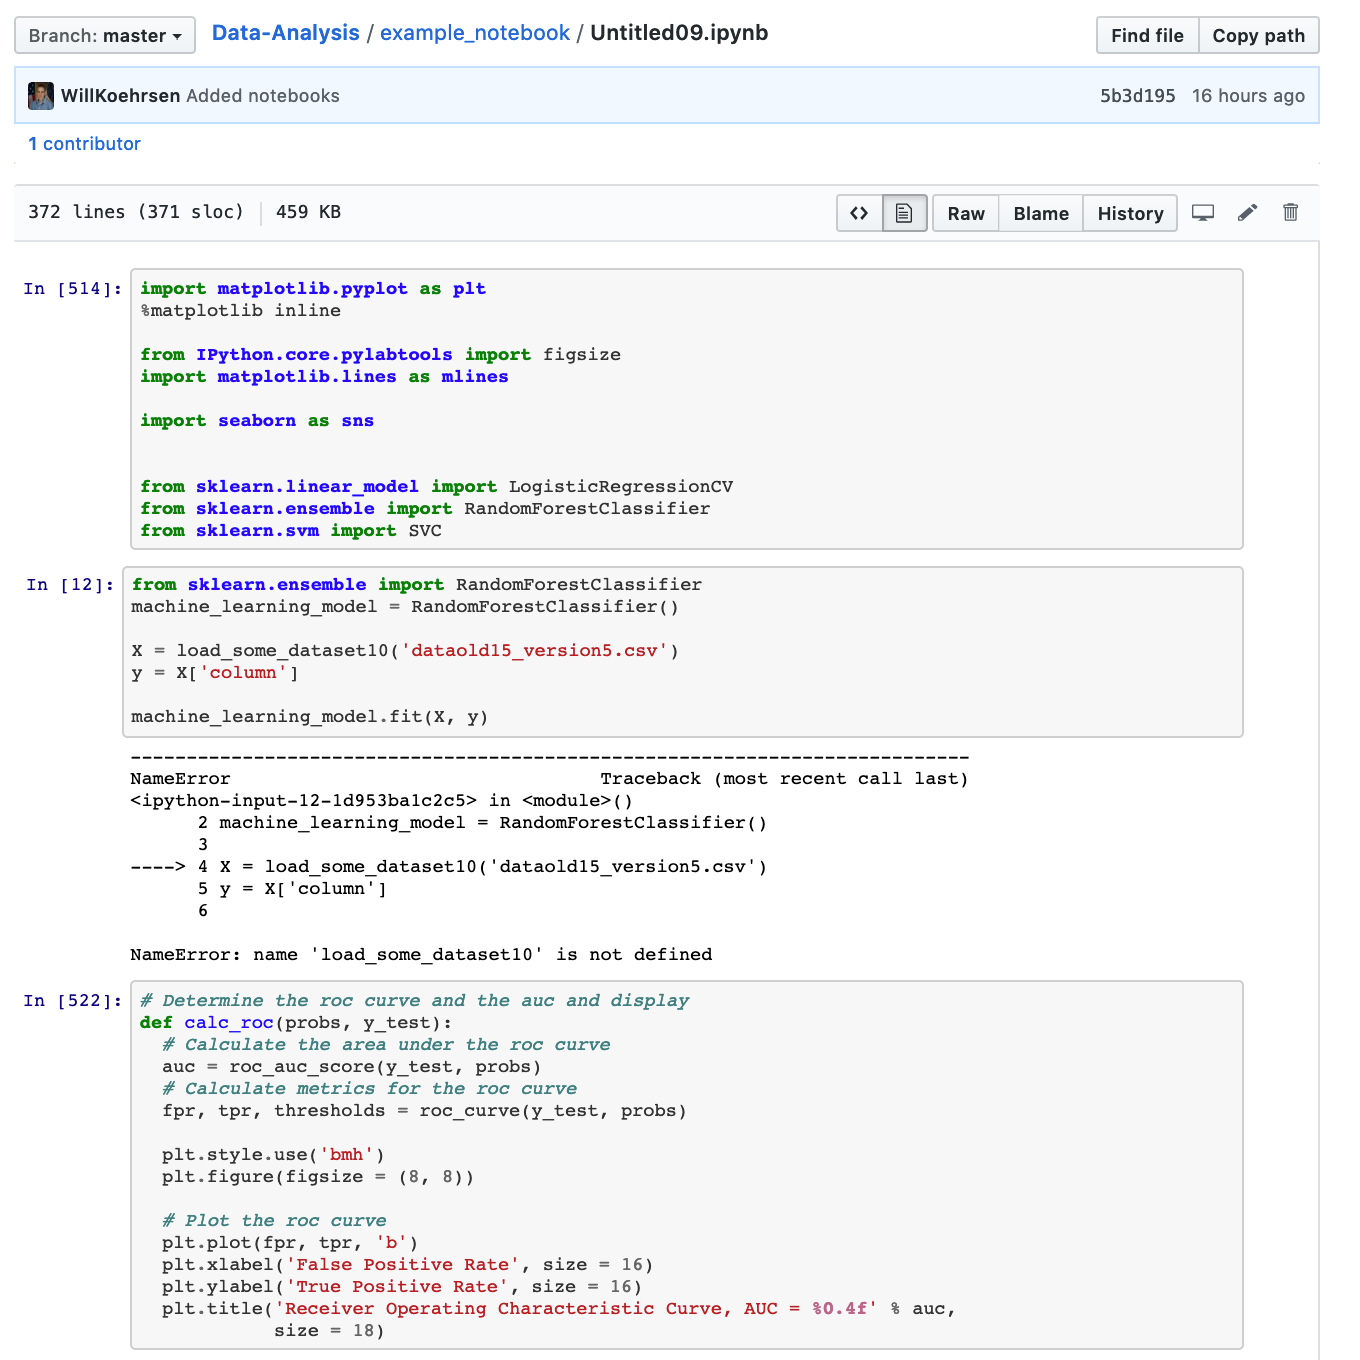
Don’t let notebooks like this get onto GitHub.

The problems are clear:

  • No title
  • No explanations of what the code should do or how it works
  • Cells run out of order
  • Errors in cell output

The Jupyter Notebook can be an incredibly useful device for learning, teaching, exploration, and communication (here is a good example). However, notebooks like the above fail on all these counts and it’s nearly impossible to debug someone else’s work or even figure out what they are trying to do when these problems appear. At the very least, anyone should be able to name a notebook something helpful, write a brief introduction, explanation, and conclusion, run the cells in order, and make sure there are no errors before posting the notebook to GitHub.

Read More

A Data Science Public Service Announcement

(Source)

Open source data science tools need your help. Fortunately, it’s easier to contribute now than ever before — here’s how to help

The best things in life are free: friends, pandas, family, numpy , sleep, jupyter notebooks, laughing, and python. On a serious note, it’s pretty incredible that the best tools for data science are available at no cost and are created not by a company with unlimited resources, but by a community of individuals, most of whom work on these projects for no pay. You can shell out $860/year for Matlab (plus extra for more libraries) or you can download Python and any library for free, getting better software and great customer support (in the form of Stack Overflow and GitHub issues) without paying a cent.

The free and open source software (FOSS) movement — where you are free to use, share, copy, and improve upon software in any way — has profoundly improved the digital tools used by companies and individuals while lowering the entry barriers to many fields (data science included ) to near zero. For those of us who grew up in the past few decades, this is the only model we know: of course software is free! However, the open-source tools we have come to depend on every day now face serious sustainability problems.

In this article, we’ll look at the issues facing FOSS and, better yet, the many steps you can take (some in as few as 30 seconds) to ensure your favorite data science tools remain free and better than the paid alternatives. Although there is a real problem, there are also numerous solutions available to all of us. (This article relies on information from “Roads and Bridges: The Unseen Labor Behind Our Digital Infrastructure” as well as the NumFocus website.)

Read More