Machine Learning With Python On The Enron Dataset

##Investigating Fraud using Scikit-learn

Author’s Note: The following machine learning project was completed as part of the Udacity Data Analyst Nanodegree that I finished in May 2017. All of the code can be found on my GitHub repository for the class. I highly recommend the course to anyone interested in data analysis (that is anyone who wants to make sense of the mass amounts of data generated in our modern world) as well as to those who want to learn basic programming skills in an project-focused format.

Introduction

Dataset Background

The Enron email + financial dataset is a trove of information regarding the Enron Corporation, an energy, commodities, and services company that infamously went bankrupt in December 2001 as a result of fraudulent business practices. In the aftermath of the company’s collapse, the Federal Energy Regulatory Commission released more 1.6 million emails sent and received by Enron executives in the years from 2000–2002 (History of Enron). After numerous complaints regarding the sensitive nature of the emails, the FERC redacted a large portion of the emails, but about 0.5 million remain available to the public. The email + financial data contains the emails themselves, metadata about the emails such as number received by and sent from each individual, and financial information including salary and stock options. The Enron dataset has become a valuable training and testing ground for machine learning practicioners to try and develop models that can identify the persons of interests (POIs) from the features within the data. The persons of interest are the individuals who were eventually tried for fraud or criminal activity in the Enron investigation and include several top level executives. The objective of this project was to create a machine learning model that could separate out the POIs. I choose not to use the text contained within the emails as input for my classifier, but rather the metadata about the emails and the financial information. The ultimate objective of investigating the Enron dataset is to be able to predict cases of fraud or unsafe business practices far in advance, so those responsible can be punished, and those who are innocent are not harmed. Machine learning holds the promise of a world with no more Enrons, so let’s get started!

Read More

Controlling Your Location In Google Chrome

A Simple Step to Regain (some) of Your Digital Autonomy

For most of us, the story of our relationship with Google is one in which we have willingly ceded to Google ever more control of our digital lives. While this has resulted in great product recommendations and personalized search results, we have to wonder when it becomes too much. Fortunately, there are a number of steps you can take to stem the loss of digital autonomy. One of the simplest actions is learning how to take control of your location in Google Chrome.

Manually Set Location Using Developer Tools

Using Google Chrome’s developer tools, you can easily set your location to any latitude and longitude coordinates. To access the developer tools in the console, press Control+Shift+I (Command+Option+J on Mac) or right-click on any web page and select inspect. Next, click the three vertical dots in the upper right of the developer tools panel (when you hover over the dots you should see “Customize and Control DevTools”). Find the “More Tools” entry, and click to expand the options. Select the “Sensors” option as shown.

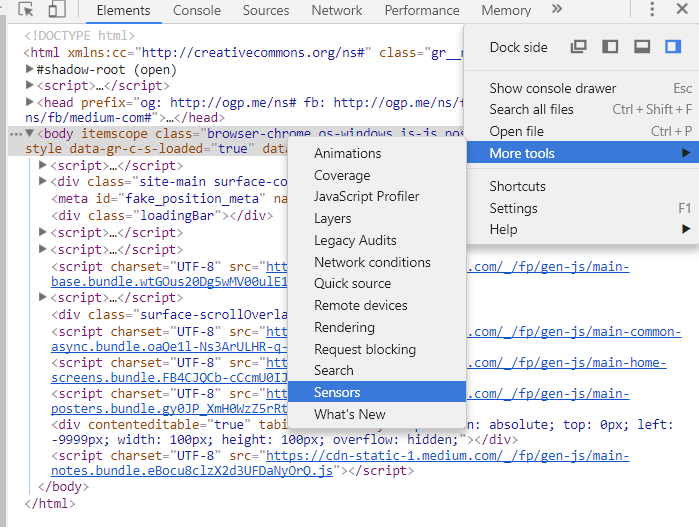
Display the Sensors Tab

Read More

Data Wrangling With Python And Sqlite

Cleaning the Cleveland Open Street Map

Author’s Note: The following exploratory data analysis project was completed as part of the Udacity Data Analyst Nanodegree that I finished in May 2017. All of the code can be found on my GitHub repository for the class. I highly recommend the course to anyone interested in data analysis (that is anyone who wants to make sense of the mass amounts of data generated in our modern world) as well as to those who want to learn basic programming skills in an project-centered format.

Introduction

OpenStreetMap (OSM) is an open-source project attempting to created a free map of the entire world from volunteer-entered data. It is maintained by the OpenStreetMap foundation and is a colloborative effort with over 2 million contributors. OpenStreetMap data is freely available to download in many formats and presents an ideal opportunity to practice the art of data wrangling for several reasons:

  • The entire dataset is user-generated meaning there will be a significant quantity of “dirty” data
  • The dataset is for any area is free to download in many formats including XML (eXtensible Markup Language)
  • The data are relatable and human-understandable because they represent real places and features

I decided to work with the metro area of Cleveland because it is where I currently attend university (at Case Western Reserve University), and I thought it would be intriguing to explore the city through the dataset after many hours spent experiencing the city on the ground. The data extract of Cleveland used for this project was downloaded from Mapzen Metro Extracts.

Read More

Data Analysis With Python

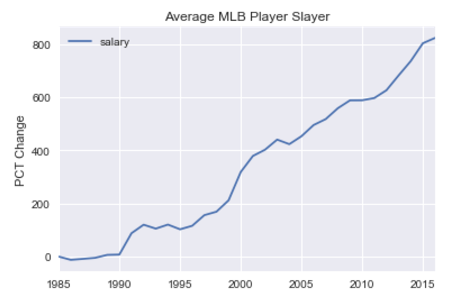
Percentage Change of Average MLB Player Salary 1985–2015

A Brief Exploration of Baseball Statistics

Author’s Note: The following exploratory data analysis project was completed as part of the Udacity Data Analyst Nanodegree that I finished in May 2017. All of the code can be found on my GitHub repository for the class. I highly recommend the course to anyone interested in data analysis (that is anyone who wants to make sense of the mass amounts of data generated in our modern world) as well as to those who want to learn basic programming skills in an application-based format.

Introduction

Since the publication of Michael Lewis’s Moneyball in 2003, there has been an explosion in interest in the field of sabermetrics, the application of empirical methods to baseball statistics. Teams looking for an edge have increasingly turned to analysis of all manner of player statistics, from the easy to understand home runs, to the exceedingly complex, such as weighted runs created and fielding independent pitching. The main goal of these efforts have been to identify players with high performance potential who may have flown under the radar and thus will not command as astronomical of a salary as more well-known names. For this analysis, I performed my own introductory sabermetrical excursion into the world of baseball statistics, although I stuck to more familiar baseball metrics for hitting and pitching such as Runs Batted In (RBI) and Earned Run Average (ERA). In particular, I was interested in the relationship or lack there of between various performance metrics for batting and pitching and player salaries. I wanted to determine which batting and pitching stats were most strongly correlated with salaries and why that might be so. However, I wanted to go further and examine a player’s change in performance metrics over seasons and how that may be related to the salary he earned. Therefore, the approach I took was to examine a single season of salaries, from 2008, and look at the hitting and pitching data from not only that year, but from the preceding two seasons (2006, 2007) and the following two seasons (2009, 2010). I had several questions about the data that I would seek to answer:

1. Which batting statistic, hits, home runs, or runs batted in, had the highest correlation with player salary? 2. Which pitching statistic, earned run average, wins, or strikeouts, had the highest correlation with pitcher salary? 3. Are these correlations higher in the two seasons preceding the salary year, or in the two seasons following the salary year? 4. What can these correlations tell us about relative player value?

Read More

The Technology Frontier

A review of Radical Technologies by Adam Greenfield

One Sentence Summary: Current and near-future technologies offer great potential for enhancing our lives, but we need to consider the inherent trade-offs in adopting products and services that dictate an increasing portion of our everyday experiences.

“We live in a society exquisitely dependent on science and technology, in which hardly anyone knows anything about science and technology”- Carl Sagan

In the nearly three decades since Carl Sagan voiced his concern, we have adopted an amazing array of technologies into our daily lives — smartphones, laptops, the World Wide Web, digital maps, Siri, Alexa, Facebook, the Internet of Things — which have increased convenience and expanded our connectivity with other individuals around the world. Yet, we still do not grasp the fundamentals behind these technologies or realize what we sacrifice when we adopt them without a moment’s hesitation. We imagine technology as a beneficial force with only positive effects — greater ease and access to information — while we overlook the trade-offs — decreased privacy and autonomy — implicit in upgrading to the latest model. Advances promised to us in the coming decades — augmented reality, 3D printing, machine learning, cryptocurrency — are designed to satisfy our needs and bring us novel forms of entertainment. Before we blindly accept these products and services, it is critical that we understand the implications of relinquishing ever more control of our day-to-day experiences to the companies that provide them. This argument forms the premise for Adam Greenfield’s Radical Technologies: The Design of Everyday Life, which explains not only how modern and near-future technologies work, but the concessions we make when these developments are woven into the fabric of modern life.

Read More