Statistical Significance Explained

What does it mean to prove something with data?

As the dean at a major university, you receive a concerning report showing your students get an average of 6.80 hours of sleep per night compared to the national college average of 7.02 hours. The student body president is worried about the health of students and points to this study as proof that homework must be reduced. The university president on the other hand dismisses the study as nonsense: “Back in my day we got four hours of sleep a night and considered ourselves lucky.” You have to decide if this is a serious issue. Fortunately, you’re well-versed in statistics and finally see a chance to put your education to use!

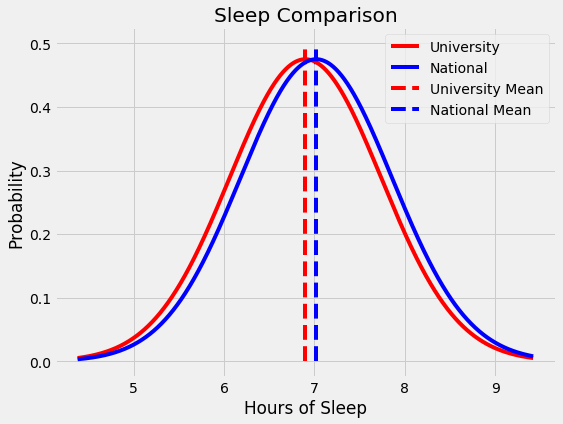
How can we decide if this is meaningful?

Statistical significance is one of those terms we often hear without really understanding. When someone claims data proves their point, we nod and accept it, assuming statisticians have done complex operations that yielded a result which cannot be questioned. In fact, statistical significance is not a complicated phenomenon requiring years of study to master, but a straightforward idea that everyone can — and should — understand. Like with most technical concepts, statistical significance is built on a few simple ideas: hypothesis testing, the normal distribution, and p values. In this article, we will briefly touch on all of these concepts (with further resources provided) as we work up to solving the conundrum presented above.

Read More

How To Master New Skills

Why trying to avoid spreadsheets is the best way to learn data science

The best way to learn a new skill is using it to solve problems. In my previous life as an aerospace engineering student, I spent hours writing complicated formulas in Excel to do everything from designing wings to calculating reentry angles of spacecraft. After hours of labor, I would present results in the bland Excel charts that dominate so many powerpoints. Convinced this was not an optimal workflow, I decided to learn Python, a common coding language, solely to avoid spending all my waking hours in Excel.

With the help of Automate the Boring Stuff with Pythonby Al Sweigart, I picked up enough of the language to cut the time I spent in Excel by 90%. Rather than memorizing the basics, I focused on efficiently solving aerospace problems. I was soon flying through assignments, and when I presented Python graphs in class, I was asked what sort of magic techniques I used. Without even trying, I gained a reputation as someone who could take a tangled spreadsheet and turn the data into illuminating images.

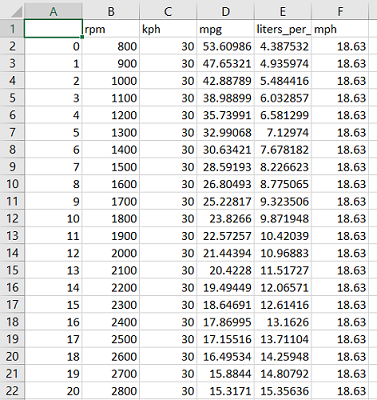
The difference between data (left) and knowledge (right)

Read More

Overfitting Vs Underfitting: A Complete Example

Exploring and solving a fundamental data science problem

When you study data science you come to realize there are no truly complex ideas, just many simple building blocks combined together. A neural network may seem extremely advanced, but it’s really just a combination of numerous small ideas. Rather than trying to learn everything at once when you want to develop a model, it’s more productive and less frustrating to work through one block at a time. This ensures you have a solid idea of the fundamentals and avoid many common mistakes that will hold up others. Moreover each piece opens up new concepts allowing you to continually build up knowledge until you can create a useful machine learning system and, just as importantly, understand how it works.

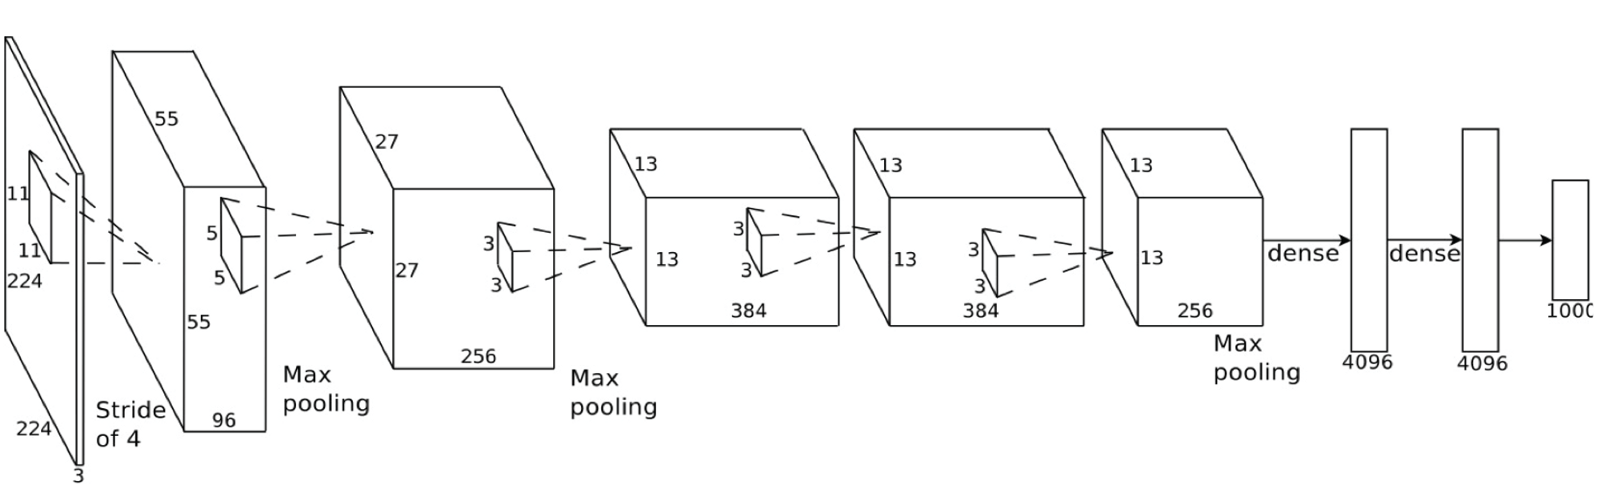
Out of simple ideas come powerful systems (Source)

This post walks through a complete example illustrating an essential data science building block: the underfitting vs overfitting problem. We’ll explore the problem and then implement a solution called cross-validation, another important principle of model development. If you’re looking for a conceptual framework on the topic, see my previous post. All of the graphs and results generated in this post are written in Python code which is on GitHub. I encourage anyone to go check out the code and make their own changes!

Read More

Overfitting Vs Underfitting: A Conceptual Explanation

An example-based framework of a core data science concept**

Say you want to learn English. You have no prior knowledge of the language but you’ve heard the greatest English writer is William Shakespeare. A natural course of action surely must be locking yourself in a library and memorizing his works. After a year of study, you emerge from your studies, travel to New York City, and greet the first person you see with “Good dawning to thee, friend!” In response, you get a look of disdain and a muttered ‘crazy’. Unperturbed, you try again: “Dear gentlewoman, How fares our gracious lady?” Another failure and a hurried retreat. After a third unsuccessful attempt, you are distraught: “What shame what sorrow!”. Shame indeed: you have just committed one of the most basic mistakes in modeling, overfitting on the training data.

In data science courses, an overfit model is explained as having high variance and low bias on the training set which leads to poor generalization on new testing data. Let’s break that perplexing definition down in terms of our attempt to learn English. The model we want build is a representation of how to communicate using the English language. Our training data is the entire works of Shakespeare and our testing set is New York. If we measure performance in terms of social acceptance, then our model fails to generalize, or translate, to the testing data. That seems straightforward so far, but what about variance and bias?

Variance is how much a model changes in response to the training data. As we are simply memorizing the training set, our model has high variance: it is highly dependent on the training data. If we read the entire works of J.K. Rowling rather than Shakespeare, the model will be completely different. When a model with high variance is applied on a new testing set, it cannot perform well because all it is lost without the training data. It’s like a student that has memorized the problems in the textbook, only to be helpless when faced with real world faced problems.

Sometimes even grad students should go outside

Read More

Learn By Sharing

Why I’m ditching the library to write a data science blog

Traditional education is simple: sit down, shut up, and listen to the teacher. After class, go to the library to repeatedly read the same words, trying to figure out abstract topics with little meaning in our daily lives. Even as a graduate student, I still am routinely lectured at and expected to spend large portions of time outside of class alone in contemplating my studies. While this might work fine for subjects that require simple regurgitation of information on a test — looking at you history — it is entirely unsuited for modern technical topics such as data science.

With that in mind, here’s a radical proposal: rather than hitting the books when you want to understand a concept, you should hit your blog and try to explain it clearly to others. The idea is simple: if you can’t teach a topic to someone else, then you truly don’t get it yourself.

Well said

When I began grad classes, I decided to take a new approach to education. Instead of sitting passively in class, I aimed to ask at least one question every lecture. This small adjustment had a profound impact on my engagement in class. I focused my questions on how to implement concepts we covered which often were presented without any practical examples. This active participation made it easier to concentrate in class and to apply topics to problems both in my research and on assignments.

Read More